Pingdom
Languages:
English
Localization:
World

What is Pingdom used for?
Pingdom Website Monitoring is a platform for tracking website availability, page performance, and real user experience. It helps businesses understand whether their websites, web applications, landing pages, checkout flows, and customer portals are working correctly from the user’s point of view. Instead of waiting for customers to report downtime or slow pages, Pingdom provides monitoring, alerts, and reports that help teams react faster.
The service is especially useful for e-commerce websites, SaaS platforms, agencies, publishers, marketing teams, and IT departments that rely on stable online access. Pingdom combines synthetic monitoring, which tests websites from controlled monitoring locations, with real user monitoring, which shows how actual visitors experience a site across different devices, browsers, and regions. This gives teams a clearer view of both technical availability and real-world performance.
What features does Pingdom offer?
-
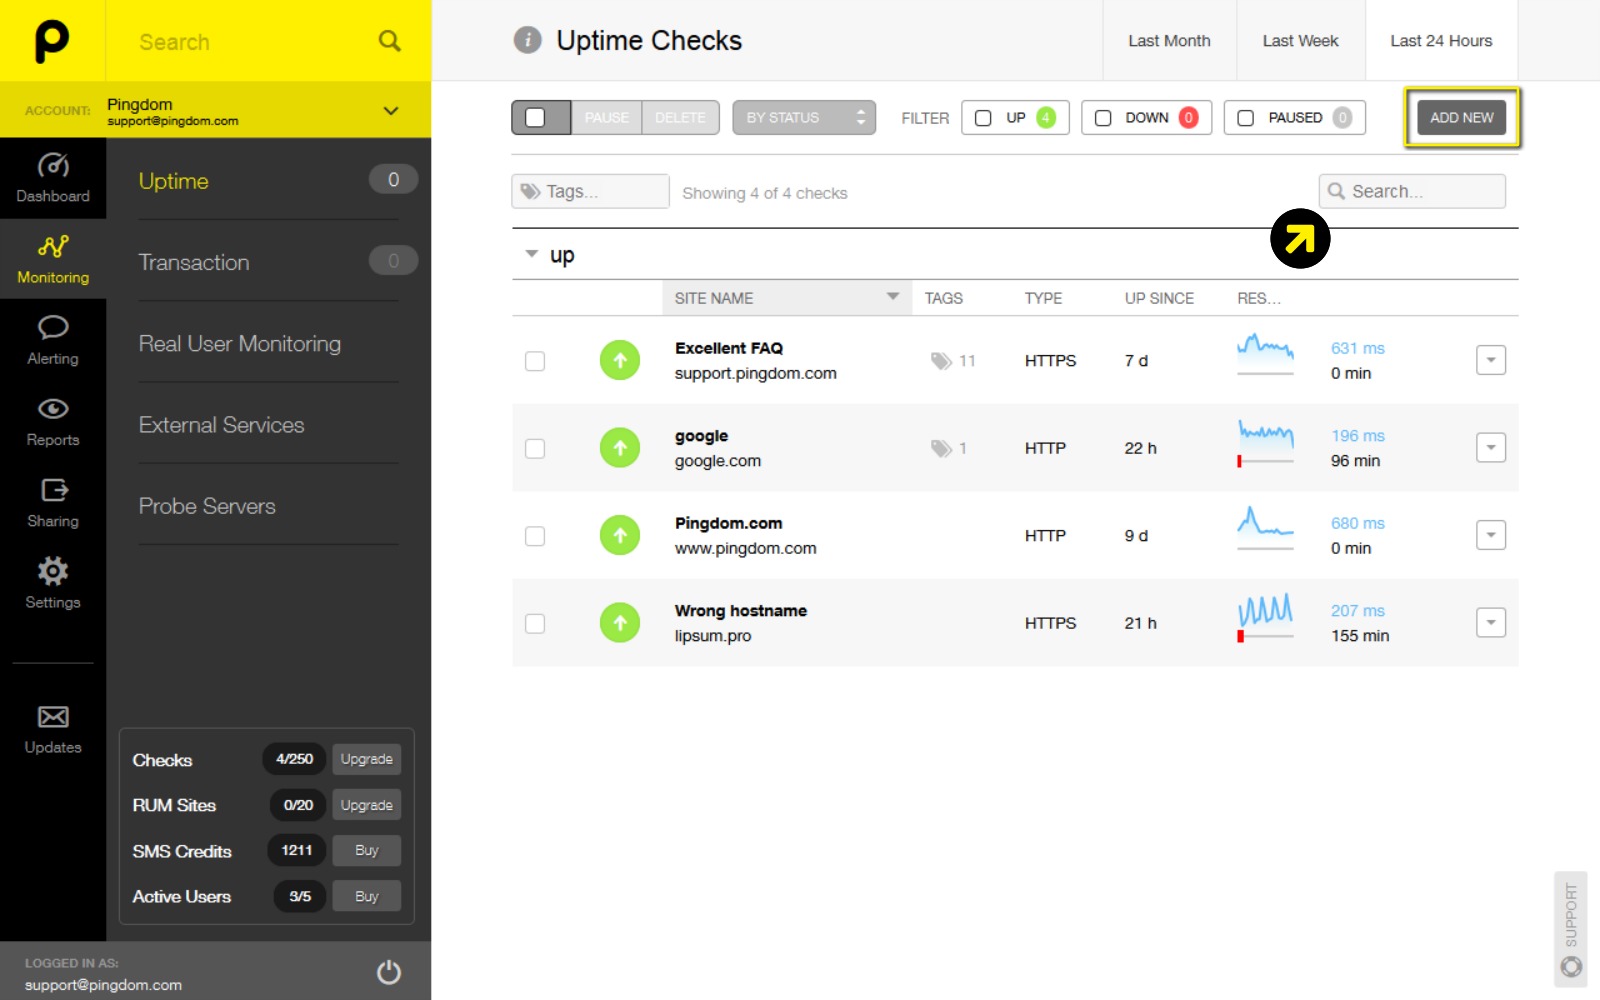
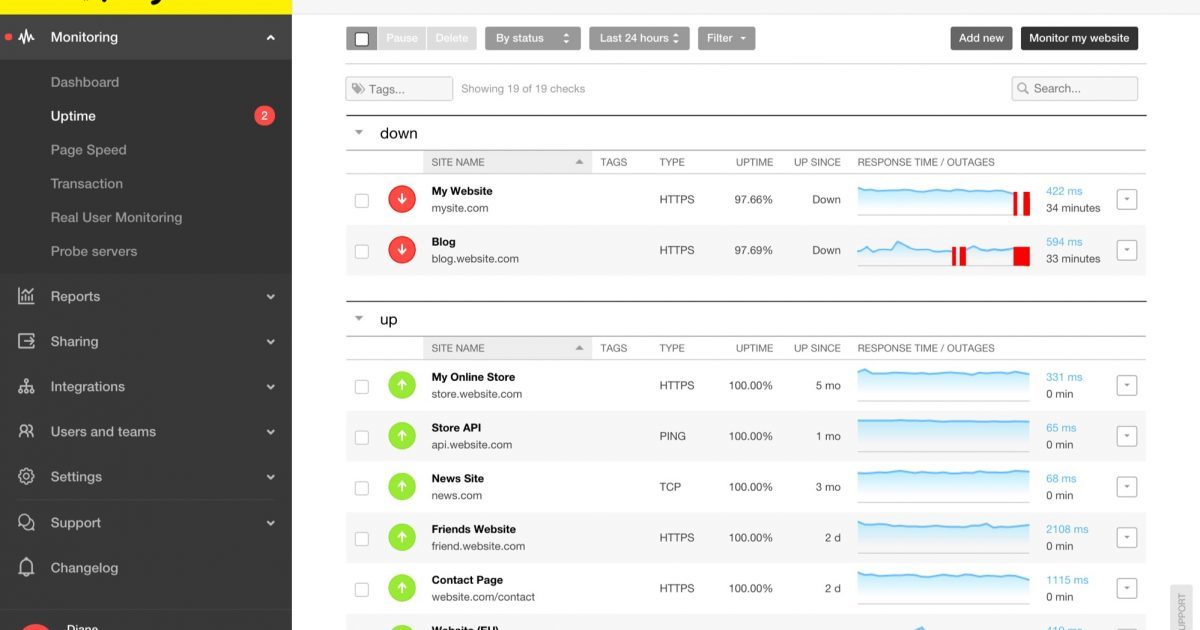
Uptime Monitoring
Pingdom checks whether websites, APIs, servers, and important pages are available. If a monitored page becomes unreachable or returns an error, teams can receive alerts and investigate the issue before it affects too many users. -
Page Speed Monitoring
Pingdom measures how fast pages load and helps identify performance bottlenecks. Teams can review load time, page size, request volume, and page elements that may slow down the visitor experience. -
Transaction Monitoring
Pingdom can test multi-step user journeys such as logging in, searching, submitting a form, adding a product to cart, or completing a checkout process. This is important because a website may be online while a key business action is still broken. -
Real User Monitoring
Real user monitoring shows how actual visitors experience a website. Teams can analyze performance by location, browser, device, and user behavior, which helps reveal issues that synthetic checks may not fully capture. -
Alerts and Notifications
Pingdom can notify teams when downtime, errors, slow responses, or content changes are detected. These alerts help reduce response time during incidents. -
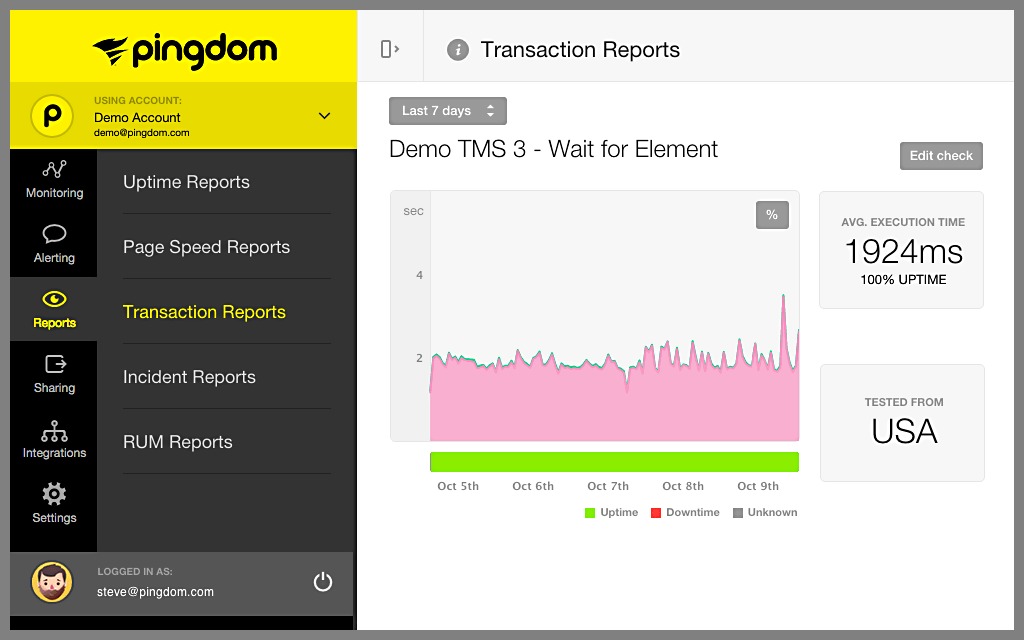
Reports and Historical Data
Pingdom provides reports on uptime, downtime, response time, outages, and performance trends. This helps teams review reliability over time and communicate results to stakeholders or clients.
Where does Pingdom fit best?
-
E-commerce websites
Online stores can monitor checkout flows, payment pages, product pages, and shopping cart actions. This helps protect revenue when even a short outage can cause lost sales. -
SaaS platforms
SaaS teams can monitor login pages, dashboards, subscription flows, public status pages, and key application endpoints. -
Marketing campaigns
Marketing teams can test campaign landing pages before and during launches to make sure paid traffic does not arrive on slow or broken pages. -
Agencies and client websites
Agencies can use Pingdom to track client website uptime, prepare performance reports, and prove that monitoring is active. -
IT and operations teams
Technical teams can use Pingdom as an external monitoring layer for public-facing services, complementing internal logs, analytics, and application monitoring tools.
What benefits can teams expect from Pingdom?
Pingdom helps teams detect problems earlier. Fast alerts can reduce downtime, protect customer trust, and prevent small technical failures from becoming visible business problems. Its page speed data also helps teams improve conversion rates, search visibility, and user satisfaction by identifying slow-loading assets or third-party scripts.
Another important benefit is business context. Pingdom does not only check whether a website is technically online. With transaction monitoring, it can verify whether important actions still work. With real user monitoring, it can show whether actual visitors are experiencing acceptable performance. This makes the platform useful for both technical teams and business teams.
Pingdom also supports better reporting. Instead of relying on scattered feedback, teams can review uptime, response time, incident history, and performance trends in one place.
How does Pingdom feel to use?
Pingdom is built around practical website monitoring rather than heavy infrastructure management. Users can create checks, configure alerts, review reports, and monitor key pages from a web dashboard. The setup is straightforward for basic uptime and page speed monitoring, while transaction checks and real user monitoring give more advanced teams deeper visibility.
For small businesses, Pingdom can act as a simple warning system for website health. For growing companies, it can become part of a broader reliability workflow. Its strongest value appears when teams monitor the pages and processes that directly affect revenue, leads, and customer experience: homepages, pricing pages, login screens, forms, checkout pages, and customer dashboards.
2026-08-19 16:33:04: Movies and Mainframes - Looper (2012) Youtube
2026-08-14 22:01:23: Data Center: More or Less | SolarWinds TechPod Youtube
2026-07-31 14:00:28: IT Bedtime Stories: The Adventures of SysAdmin Sally | SysAdmin Day 2026 Youtube
2026-07-17 16:19:09: Bringing CARE to Life | SolarWinds Culture Youtube
2026-07-16 18:19:31: Security Event Manager | Anomalous Events Tech Preview Youtube
2026-07-16 14:31:41: The Human Side of Autonomous IT: Eric Bauer on SW1 and the 2026 IT Trends Report Youtube
2026-07-15 21:51:06: SolarWinds Service Desk Onboarding - 14. Best Practices & Preparing for Go-Live Youtube
2026-07-15 21:46:16: SolarWinds Service Desk Onboarding - 13. Expanding Beyond IT: Adding a Service Provider (ESM) Youtube
2026-07-15 21:46:07: SolarWinds Service Desk Onboarding - 11. Integrations: Connecting Your Stack Youtube
2023-02-08 20:23:01: Pingdom provides critical user experience data and gives you visibility into how your users are interacting with your site. Learn more in this whitepaper: https://t.co/dFjWOBoNxG https://t.co/xF9zols6oeTwitter
2023-01-09 19:15:00: How long do you wait for a page to load before bouncing? Speed and outstanding user experience should be #APM top priorities. Learn more here: https://t.co/yovxYvoLZiTwitter
2023-01-05 19:35:00: Wondering why so many sites have been slow or unavailable lately? Learn more in this blog: https://t.co/wiLpX6somSTwitter
2023-01-03 19:38:24: For a great user experience, some of the most important metrics include:
⌚️ Time spent on a page/site
👀 Page views
🌎 Geographical area
❌ Error rate
And more! Learn more here: https://t.co/fUwO5UPkZmTwitter
2022-12-28 17:07:00: Some tips for expanding #APM across the application stack:
🔨 Build on existing monitoring support
🖥 Automate monitoring
✅ Validate performance
Learn more: https://t.co/NBoIgYBgkCTwitter
2022-12-26 19:26:42: Why did you invest in #APM? Was it because of faster troubleshooting, less downtime, or improved user experience? Let us know in the comments. https://t.co/ZdpwuUySoITwitter
2022-12-22 16:23:00: A truly hybrid #APM environment requires ending the silos between Dev and Ops. After reading this blog, comment for Dev, and like for Ops! https://t.co/If1kYbkdblTwitter
2022-12-01 19:23:01: Are you among the enterprises with applications and infrastructure running in or moving to the cloud? SolarWinds Observability is just for you. Learn more here: https://t.co/hV2bBpXA8y https://t.co/nun1yXpvP2Twitter
Pingdom Alternatives