
Kissmetrics
Languages:
English
Localization:
World
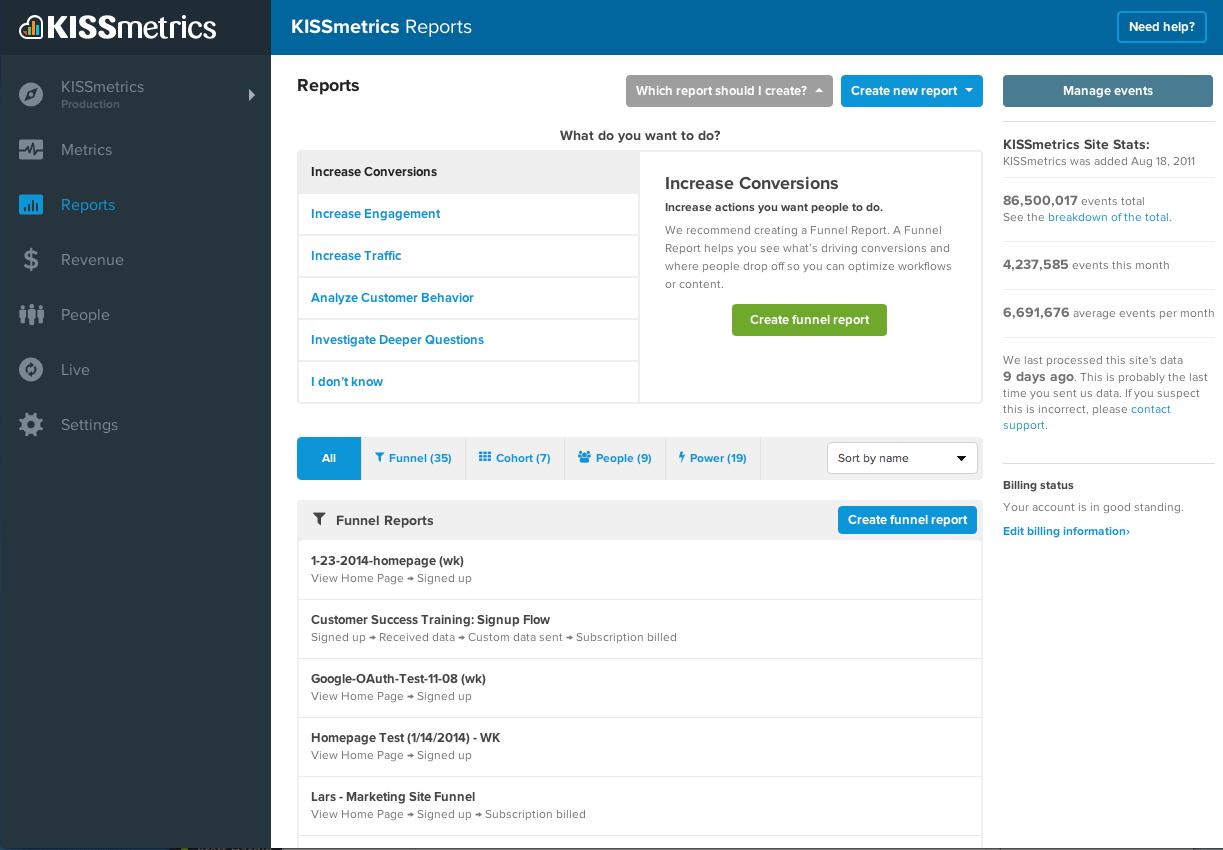
What is Kissmetrics?
Kissmetrics is a person-based analytics platform built to answer the “who did what” questions. Instead of treating users as anonymous sessions, it binds events and behaviors to individual people or accounts. With that, teams can track each user’s journey through a product or site, build cohorts, analyze retention curves, and tie behaviors to revenue. Kissmetrics is designed for product, growth, and marketing teams that want more than “pageviews and sessions” — they want to see how features perform, where users drop off, and what drives churn or lifetime value. Its strength lies in combining behavioral and revenue analytics so you can see not just what people do, but what those actions mean for business metrics and monetization.
What are the key features?
-
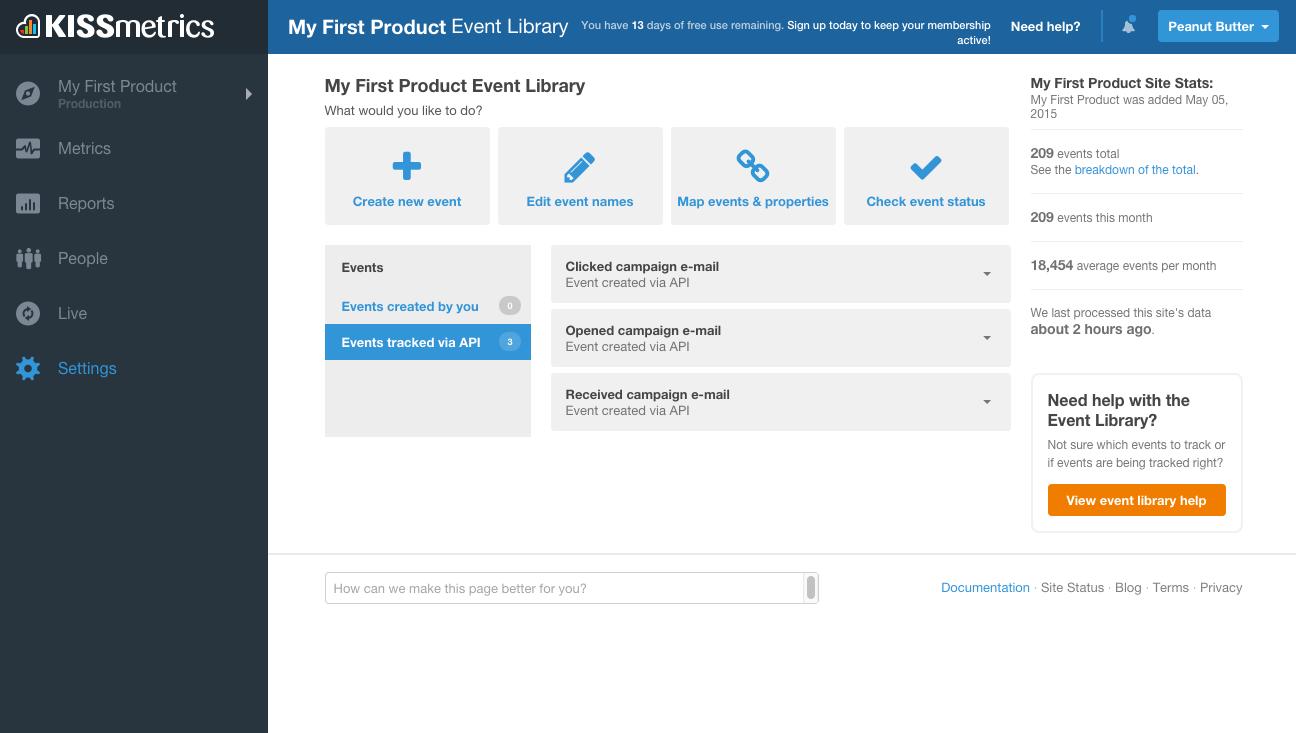
Event & Person Tracking
You define custom events such as sign-ups, clicks, or purchases and connect them to identified users, allowing you to follow behavior across time and devices. -
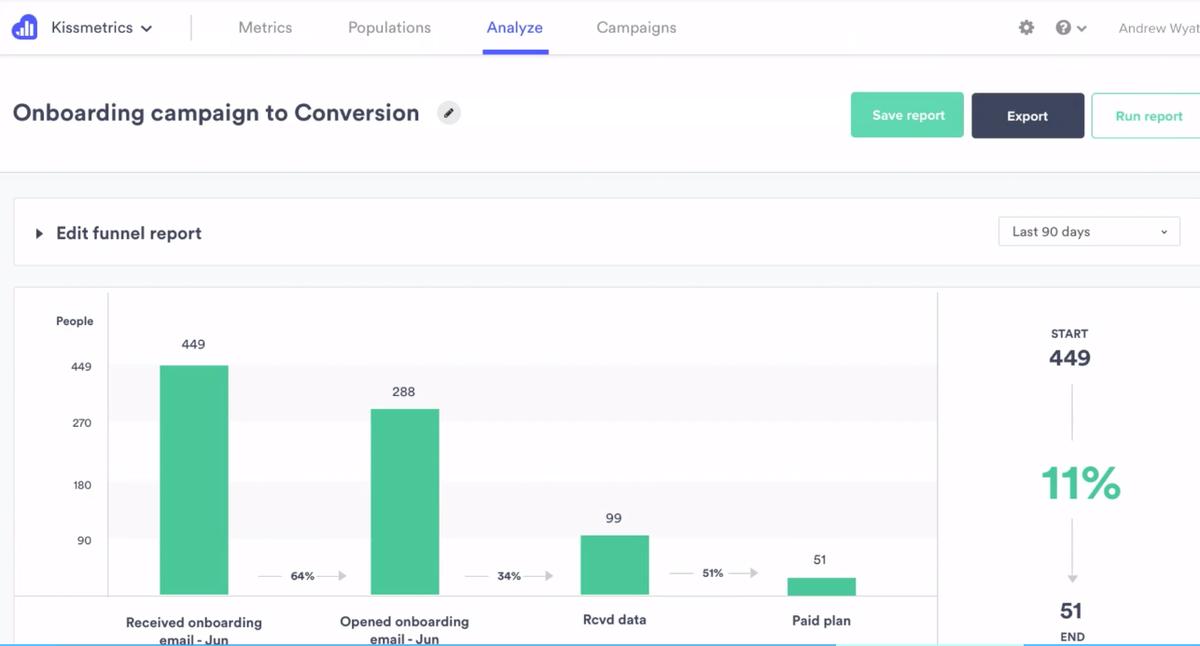
Funnels & Dropoff Analysis
Build multi-step funnels to visualize where users fail to progress. See conversion rates at each stage and segment by user cohorts or attributes. -
Cohort & Retention Analysis
Group users by shared behavior or time period to monitor retention, engagement, or conversion over time and uncover patterns that affect loyalty. -
Revenue & LTV Attribution
Tie user actions to revenue. Measure upgrades, renewals, purchases, and lifetime value to connect behavioral data directly to financial outcomes. -
Segmentation & Advanced Filtering
Break down your audience by demographics, plan types, or behavioral triggers, then apply those filters across funnels and reports. -
Custom Dashboards & Reporting
Build dashboards tailored to product, marketing, or leadership teams. Combine metrics, visualizations, and trends into one consistent view. -
Integrations, Exports & BI Access
Export raw data, use APIs or SQL access, and integrate with other analytics or marketing tools for deeper analysis. -
A/B Testing & Experimentation
Run experiments on product features or user flows, compare results, and understand which variations drive measurable improvement.
What are common use cases?
-
Optimizing Onboarding & Activation
Track user steps from sign-up to first success. Identify where people get stuck and refine the onboarding process to improve activation. -
Feature Adoption & Cross-Sell Tracking
Measure which features drive engagement or upgrades. Compare behavior before and after launches to determine adoption impact. -
Churn & Retention Prevention
Detect behavior linked to churn and intervene early. Identify signals like decreased usage or inactivity and trigger campaigns to re-engage users. -
E-commerce Purchase Funnel & Repeat Buying
Analyze the entire purchase journey — from visit to checkout to repeat orders — and optimize each stage to increase revenue. -
Marketing Attribution & Channel ROI
Understand which channels bring in the most valuable users over time. Attribute conversions and retention to specific campaigns or traffic sources. -
B2B / Account-Level Insights
Roll up individual user activity into account-level analytics to gauge customer health, usage depth, and expansion opportunities.
What benefits does it bring?
-
Clarity and Actionable Insights
Provides a clear picture of behaviors that drive conversion, retention, or churn, enabling teams to make informed, data-driven decisions. -
Revenue-Focused Metrics
Tracks how user actions impact lifetime value, churn rate, and revenue, keeping business outcomes at the center of analytics. -
Unified Team View
Aligns product, marketing, and growth teams around the same dashboards and KPIs, eliminating conflicting interpretations of data. -
Faster Iteration and Testing
Funnels and cohort reports make it easy to spot issues quickly, run experiments, and measure the impact of changes. -
High ROI Potential
Even small improvements in conversion or retention can deliver substantial returns, especially for SaaS or subscription businesses. -
Flexible and Scalable
Works with APIs, raw data, and integrations so you can expand capabilities as your analytics maturity grows.
What is the user experience like?
Kissmetrics offers a clean, structured dashboard that revolves around tracking real users and events. The interface is straightforward — dashboards, funnels, and cohorts are easy to create without deep technical skills. Users can quickly build reports, select events, define segments, and view trends with minimal setup. The person-based model removes the confusion of session-based analytics, offering a direct view of how people actually use your product.
For analysts, raw data exports and SQL access allow deep dives beyond visual reports. While the tool is approachable for non-technical users, the initial setup — defining events and implementing tracking — requires coordination between developers and analysts. Once configured, the system delivers ongoing insights with little maintenance, providing teams a shared, reliable understanding of user behavior, retention, and growth drivers.

