
Nagios Network Analyzer
Languages:
English
Localization:
World
What is Nagios Network Analyzer?
Nagios Network Analyzer Traffic Monitoring is a network traffic analysis platform designed for IT teams that need clear visibility into bandwidth usage, traffic patterns, and network behavior. It helps organizations understand who is using the network, which applications are consuming bandwidth, where traffic is flowing, and when unusual activity appears.
Unlike basic uptime monitoring, Nagios Network Analyzer focuses on traffic intelligence. It collects and analyzes flow data from supported network devices, allowing administrators to inspect conversations between hosts, identify top bandwidth consumers, and investigate performance problems. This makes it useful for companies that manage complex networks, remote offices, data centers, or infrastructure where downtime directly affects operations.
The service is especially valuable for network administrators, system engineers, IT operations teams, and security-focused infrastructure managers. It can help detect congestion, support capacity planning, investigate suspicious traffic, and improve daily network control. For organizations already using Nagios monitoring tools, it can also become part of a wider infrastructure visibility stack.
What are the key features of Nagios Network Analyzer?
- Network flow analysis
Nagios Network Analyzer processes traffic flow data from network devices to show how data moves across infrastructure. This helps teams understand communication between hosts, protocols, ports, and services. - Bandwidth usage monitoring
The platform helps identify how much bandwidth is being consumed, where traffic spikes occur, and which parts of the network are under pressure. This is important for preventing slowdowns and planning upgrades. - Top talker reporting
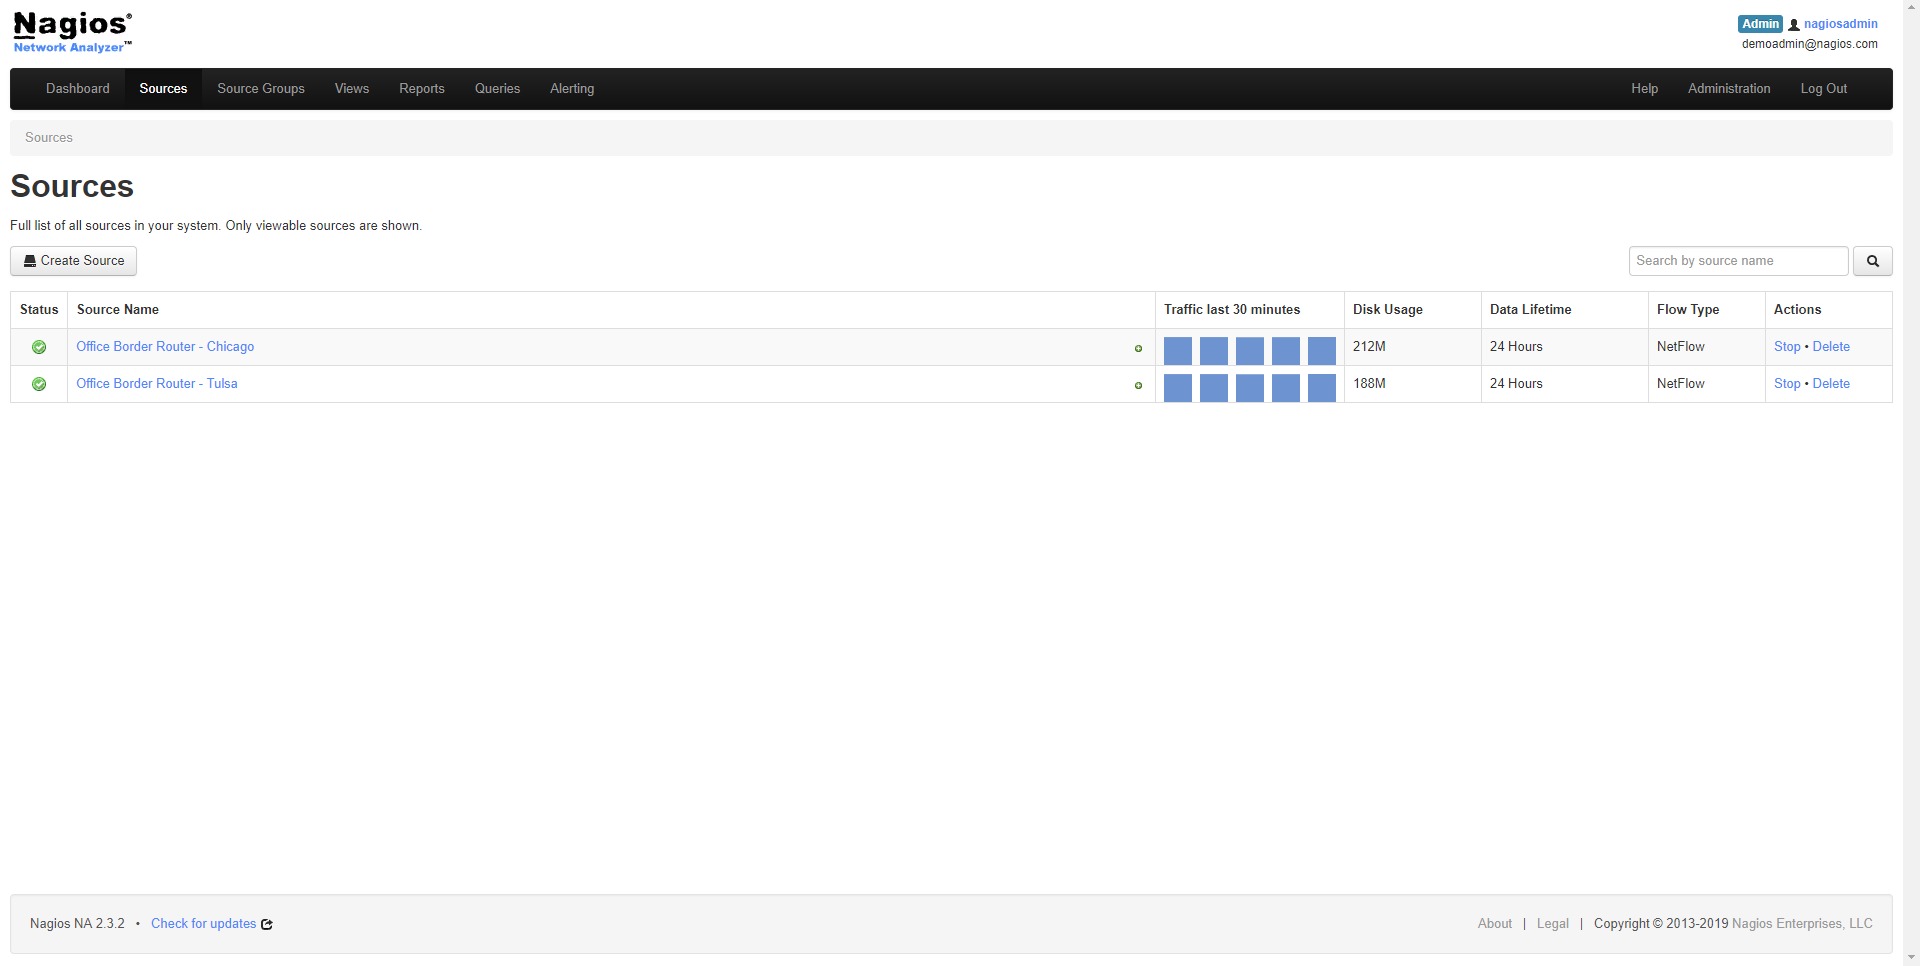
Administrators can see which IP addresses, devices, users, or applications generate the most traffic. This makes it easier to detect overloaded systems, misconfigured services, unauthorized usage, or abnormal traffic behavior. - Traffic source visibility
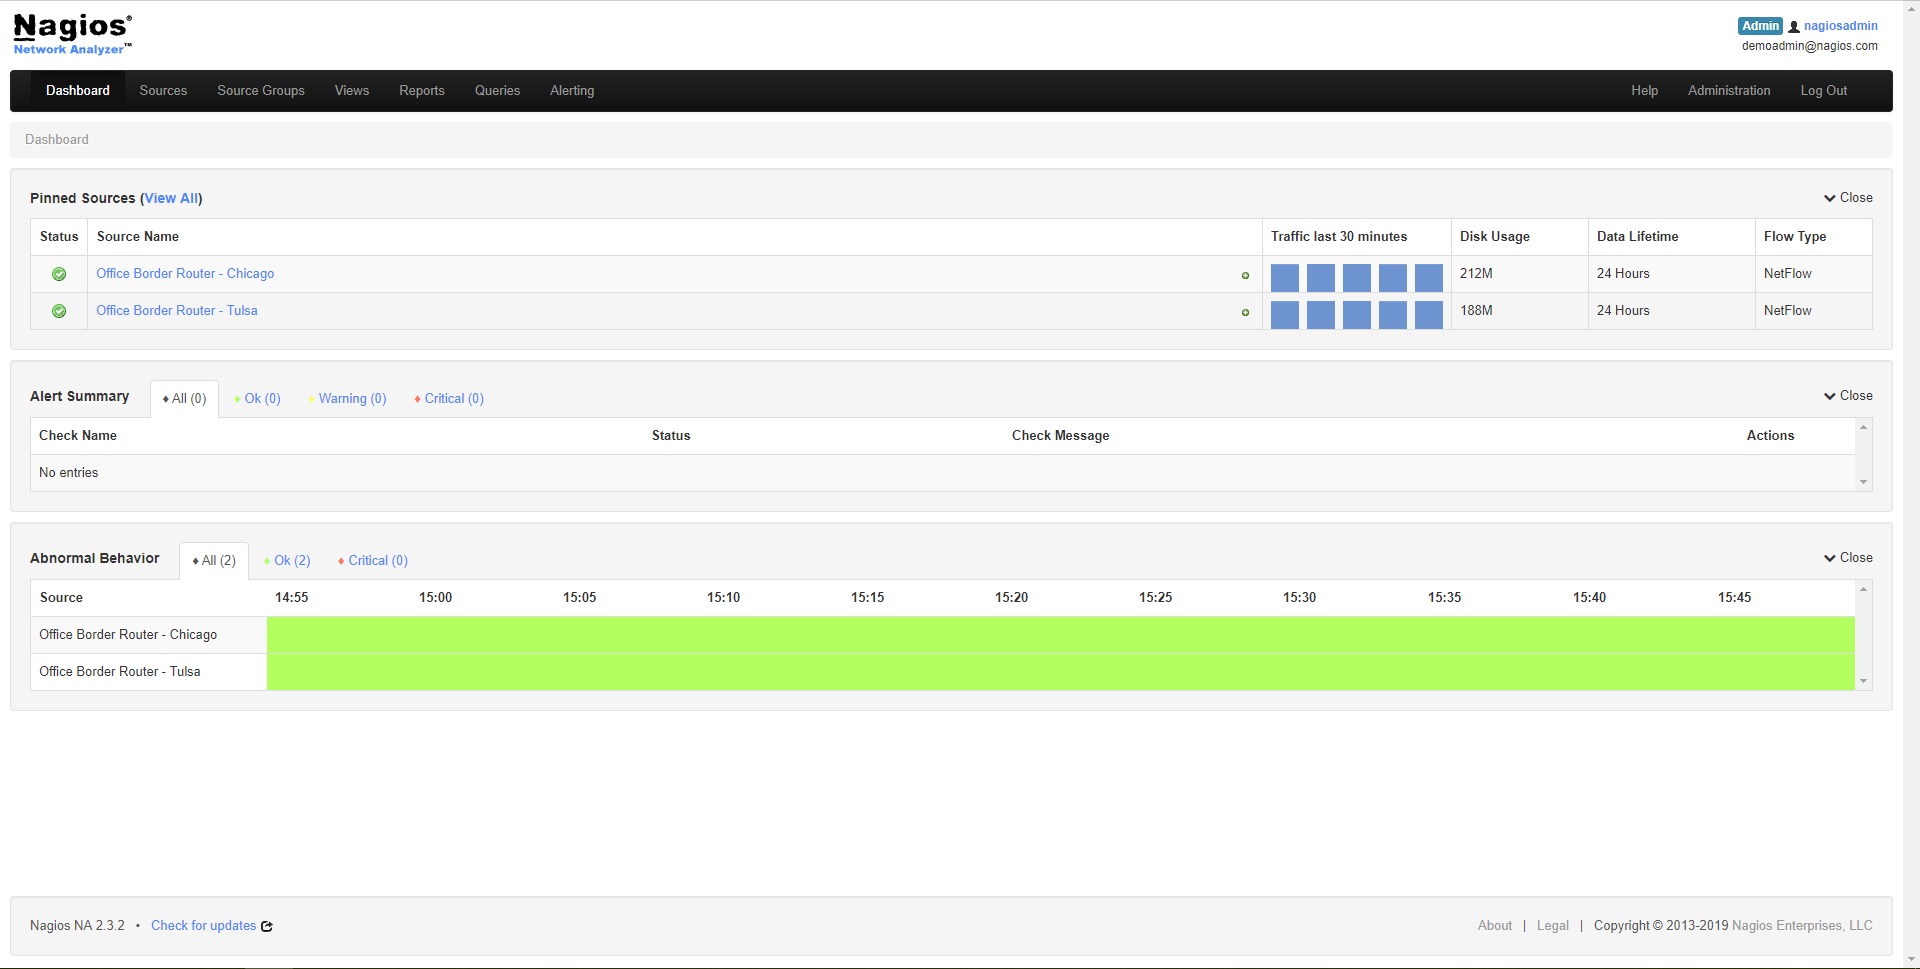
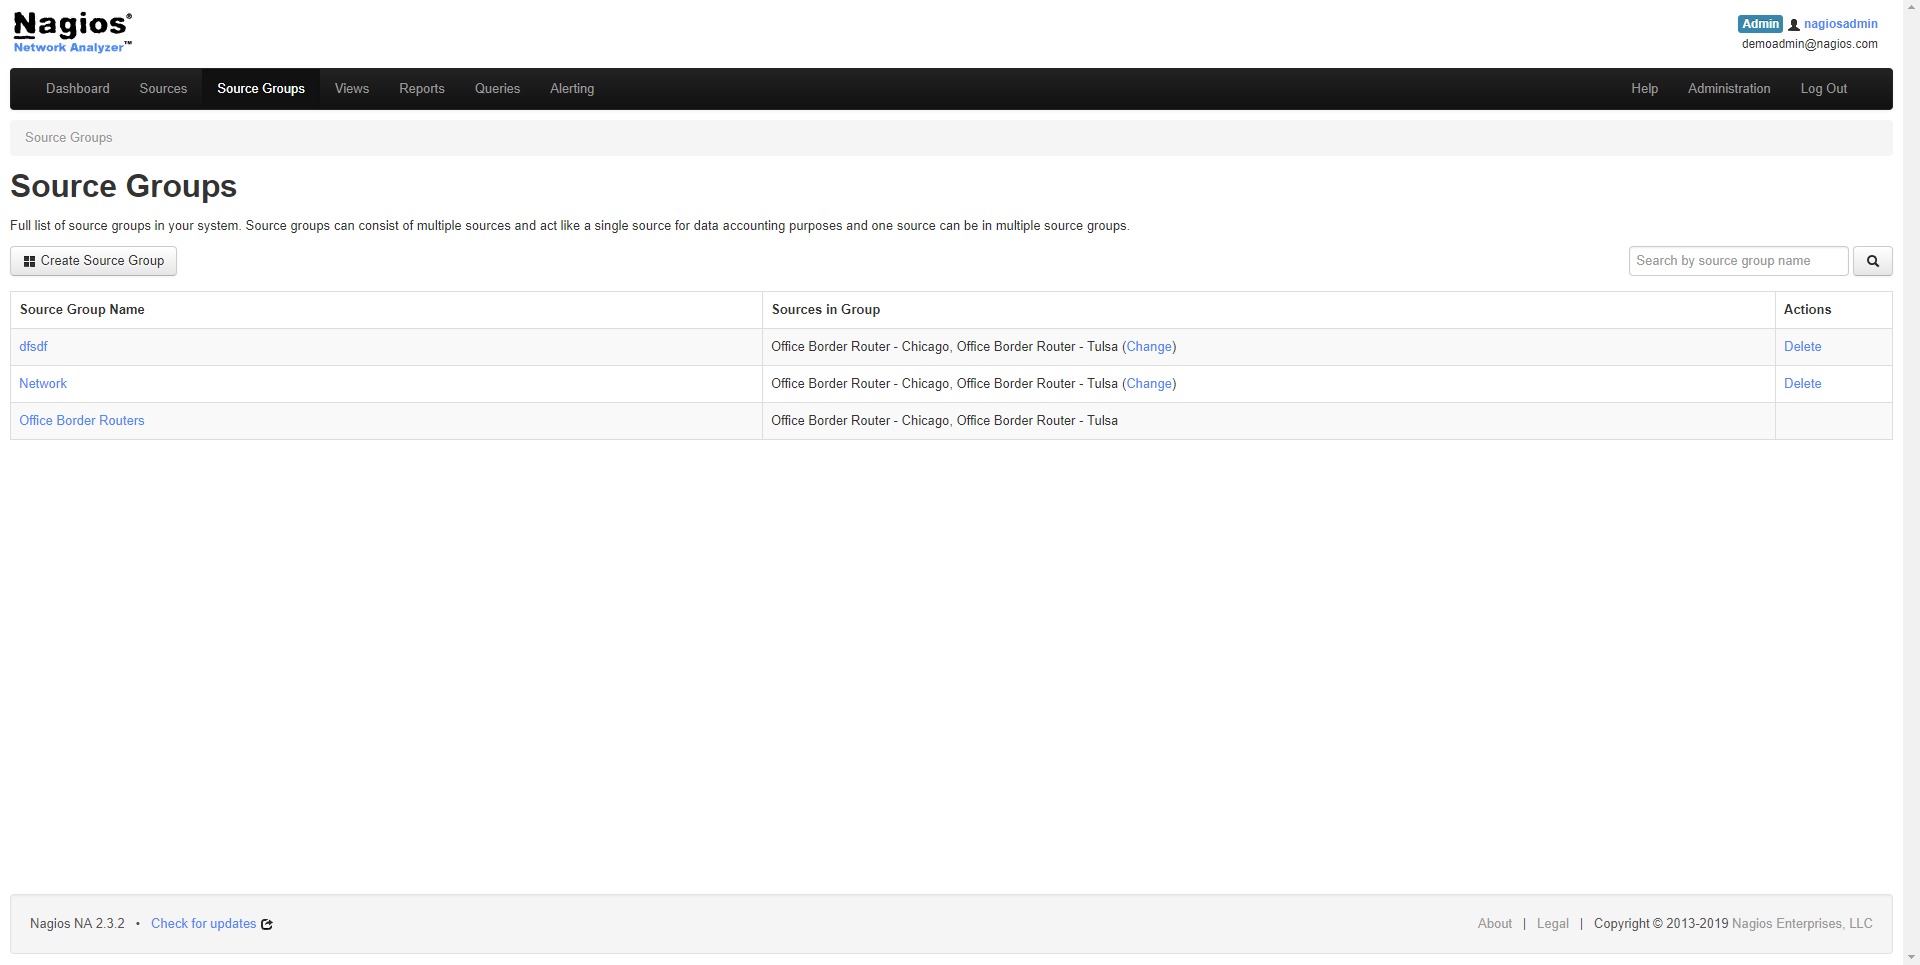
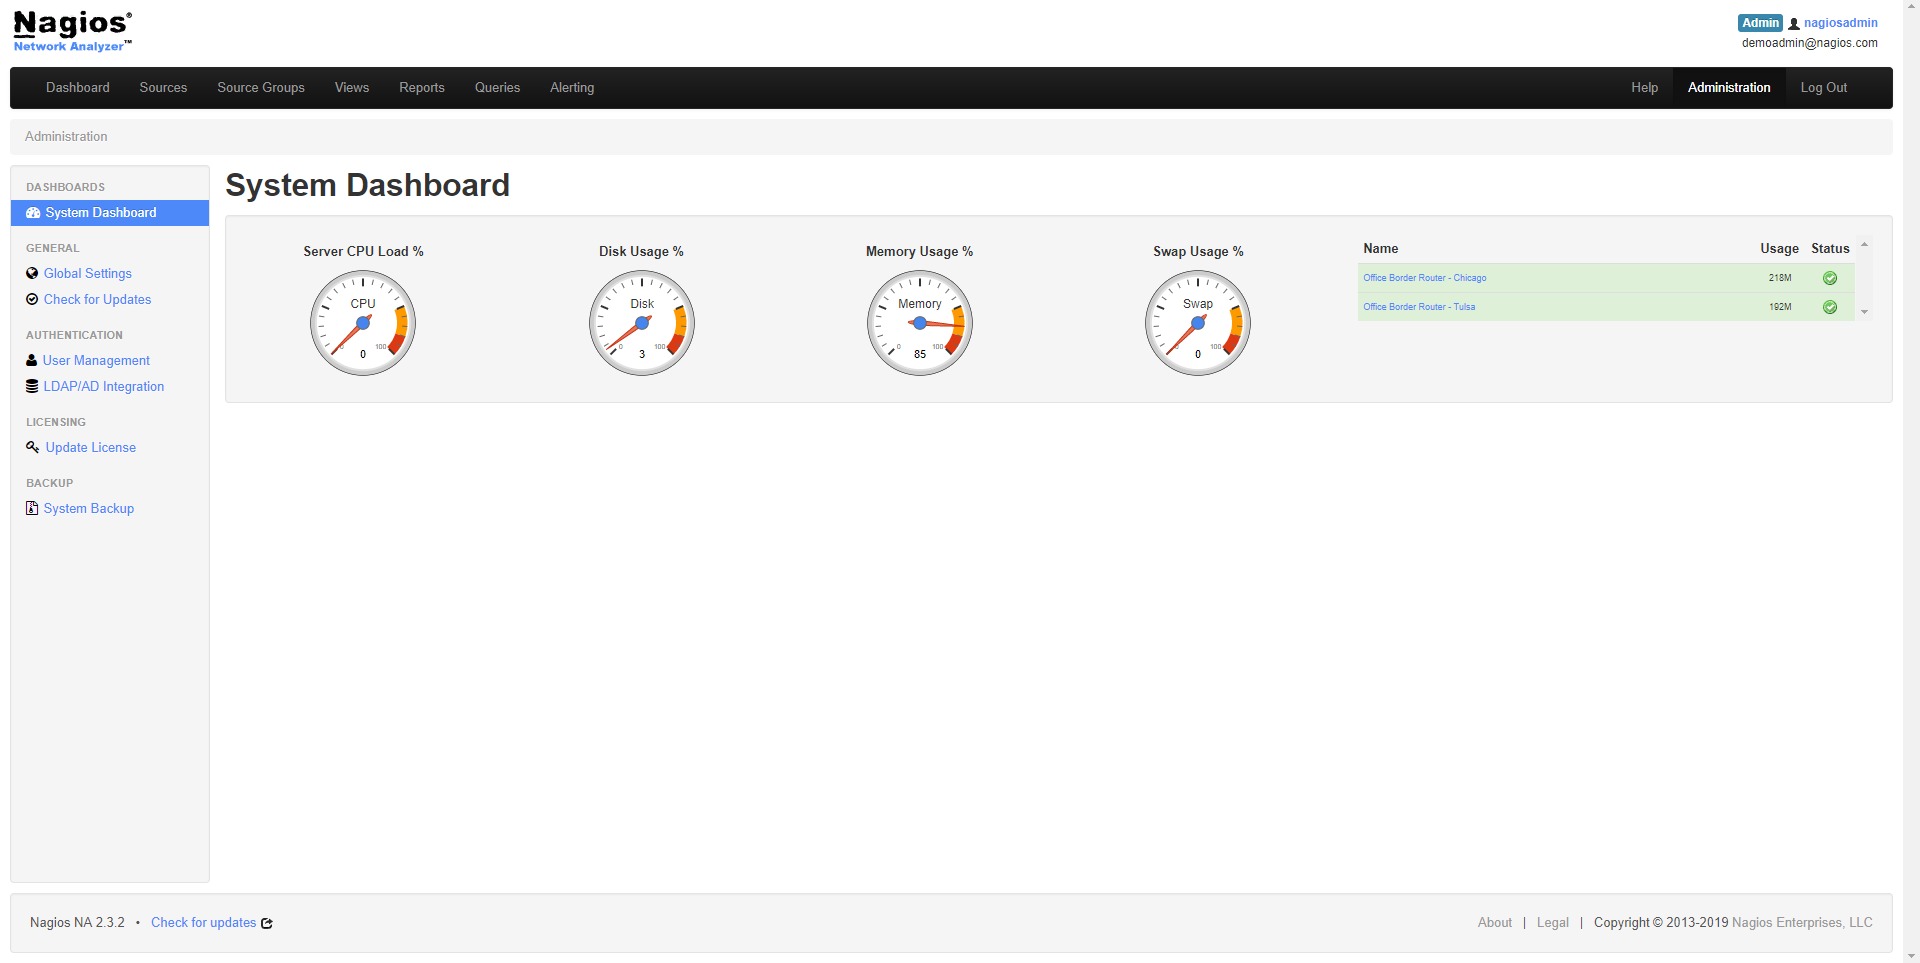
The system can organize and display traffic data from multiple network sources. This is useful for companies with several routers, switches, locations, or segmented networks. - Custom dashboards
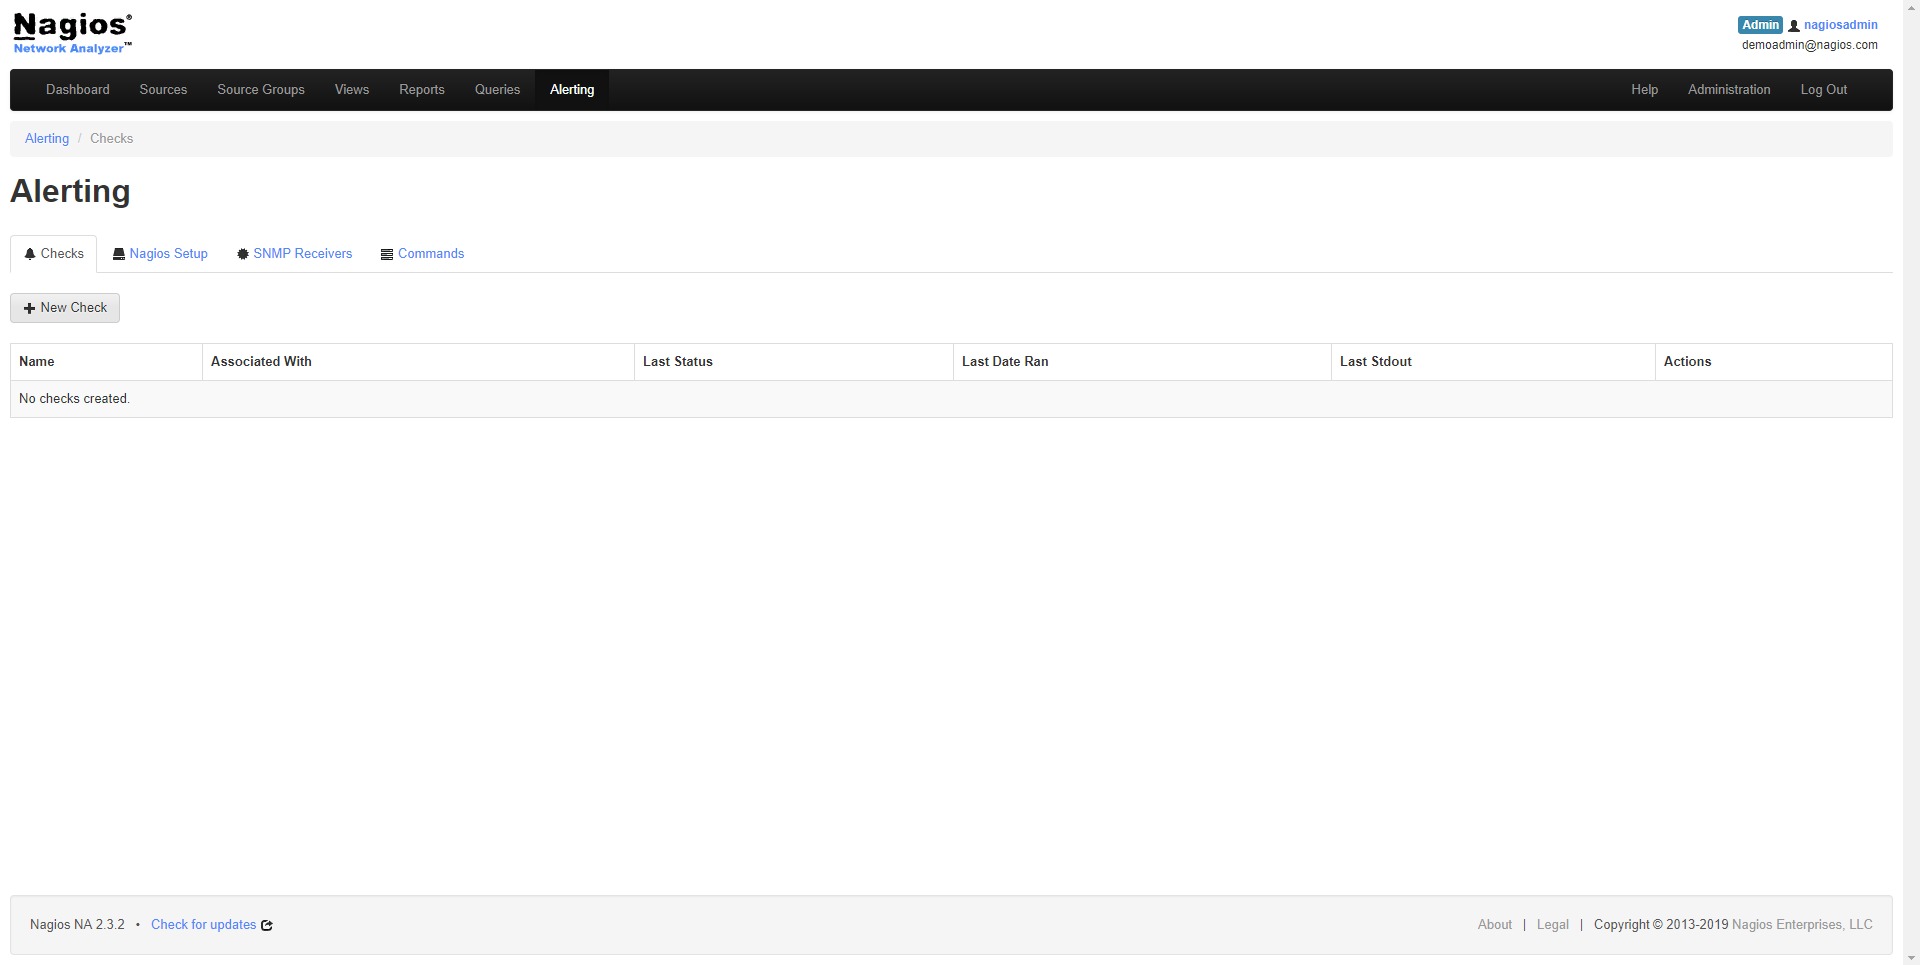
Users can create dashboards that show important traffic metrics, active sources, alerts, and network summaries. Dashboards help technical teams monitor the network without manually rebuilding reports every time. - Alerting and notifications
Nagios Network Analyzer can trigger alerts when specific traffic conditions appear. This helps teams respond faster to bandwidth spikes, suspicious patterns, or network behavior that requires attention. - Security investigation support
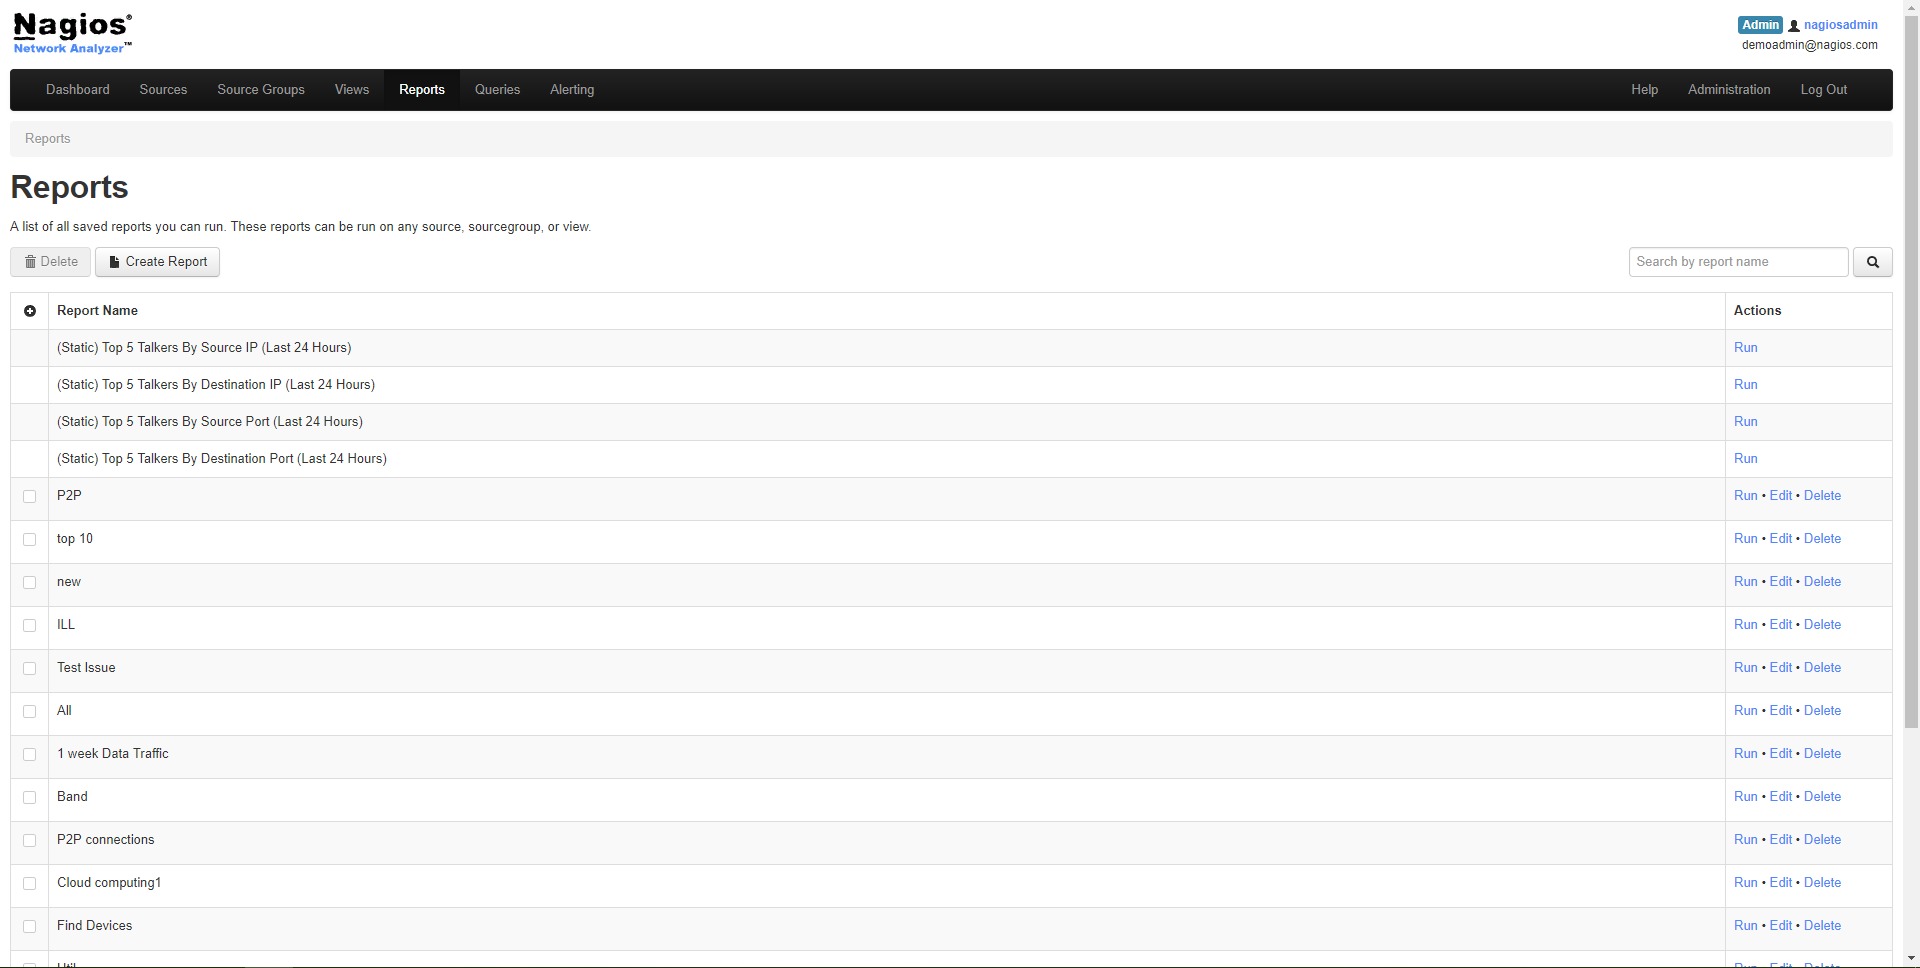
The platform can help identify unusual traffic patterns, unexpected connections, strange port usage, or sudden communication with unknown systems. It is not a full security platform by itself, but it strengthens network visibility. - Historical traffic analysis
Historical reports allow teams to review previous network behavior, compare trends, and understand whether a problem is temporary, recurring, or growing over time. - Integration with Nagios ecosystem
For teams using other Nagios products, Network Analyzer can support a more connected monitoring workflow where traffic visibility sits beside infrastructure, server, and service monitoring.
How can businesses use Nagios Network Analyzer?
- Troubleshooting slow network performance
When users complain that applications, websites, internal tools, or remote connections are slow, IT teams can inspect traffic data to find the real source of the issue. - Finding bandwidth-heavy applications
Businesses can identify applications or services that consume too much bandwidth. This helps reduce waste, control performance issues, and prioritize critical business systems. - Monitoring remote offices and distributed networks
Companies with several locations can use the platform to understand how traffic behaves across different branches, network links, and infrastructure zones. - Investigating suspicious network activity
If unusual traffic appears, administrators can review source and destination data, ports, flow volume, and communication patterns to support further investigation. - Planning network capacity
Historical usage data helps teams decide when to upgrade links, redesign network segments, or optimize routing. This replaces guesswork with actual traffic evidence. - Supporting IT operations reporting
Network teams can use reports and dashboards to explain performance issues, document traffic trends, and show management why infrastructure changes are needed.
What are the benefits of Nagios Network Analyzer?
Nagios Network Analyzer gives organizations better control over network visibility. Instead of reacting blindly to complaints about slow systems, IT teams can investigate traffic data and identify what is actually happening.
The platform helps reduce downtime risk by detecting unusual bandwidth usage and suspicious communication patterns earlier. It also improves troubleshooting speed because administrators can quickly narrow down whether a problem is caused by a host, application, protocol, network segment, or external traffic source.
Another major benefit is capacity planning. Businesses often upgrade infrastructure too late or spend money too early. With historical traffic analysis, teams can make more accurate decisions based on real usage trends.
Nagios Network Analyzer also supports better communication between technical and non-technical stakeholders. Dashboards and reports make it easier to explain why a network is overloaded, why a service is slow, or why investment in infrastructure is necessary.
For organizations already using Nagios tools, the product can become part of a broader monitoring environment. This creates stronger operational awareness across servers, services, devices, and traffic flows.
What is the user experience like?
The user experience of Nagios Network Analyzer is built for technical users who understand networks, infrastructure, ports, protocols, and traffic patterns. It is not a simple consumer-style analytics tool. It is designed for administrators who need depth, precision, and operational control.
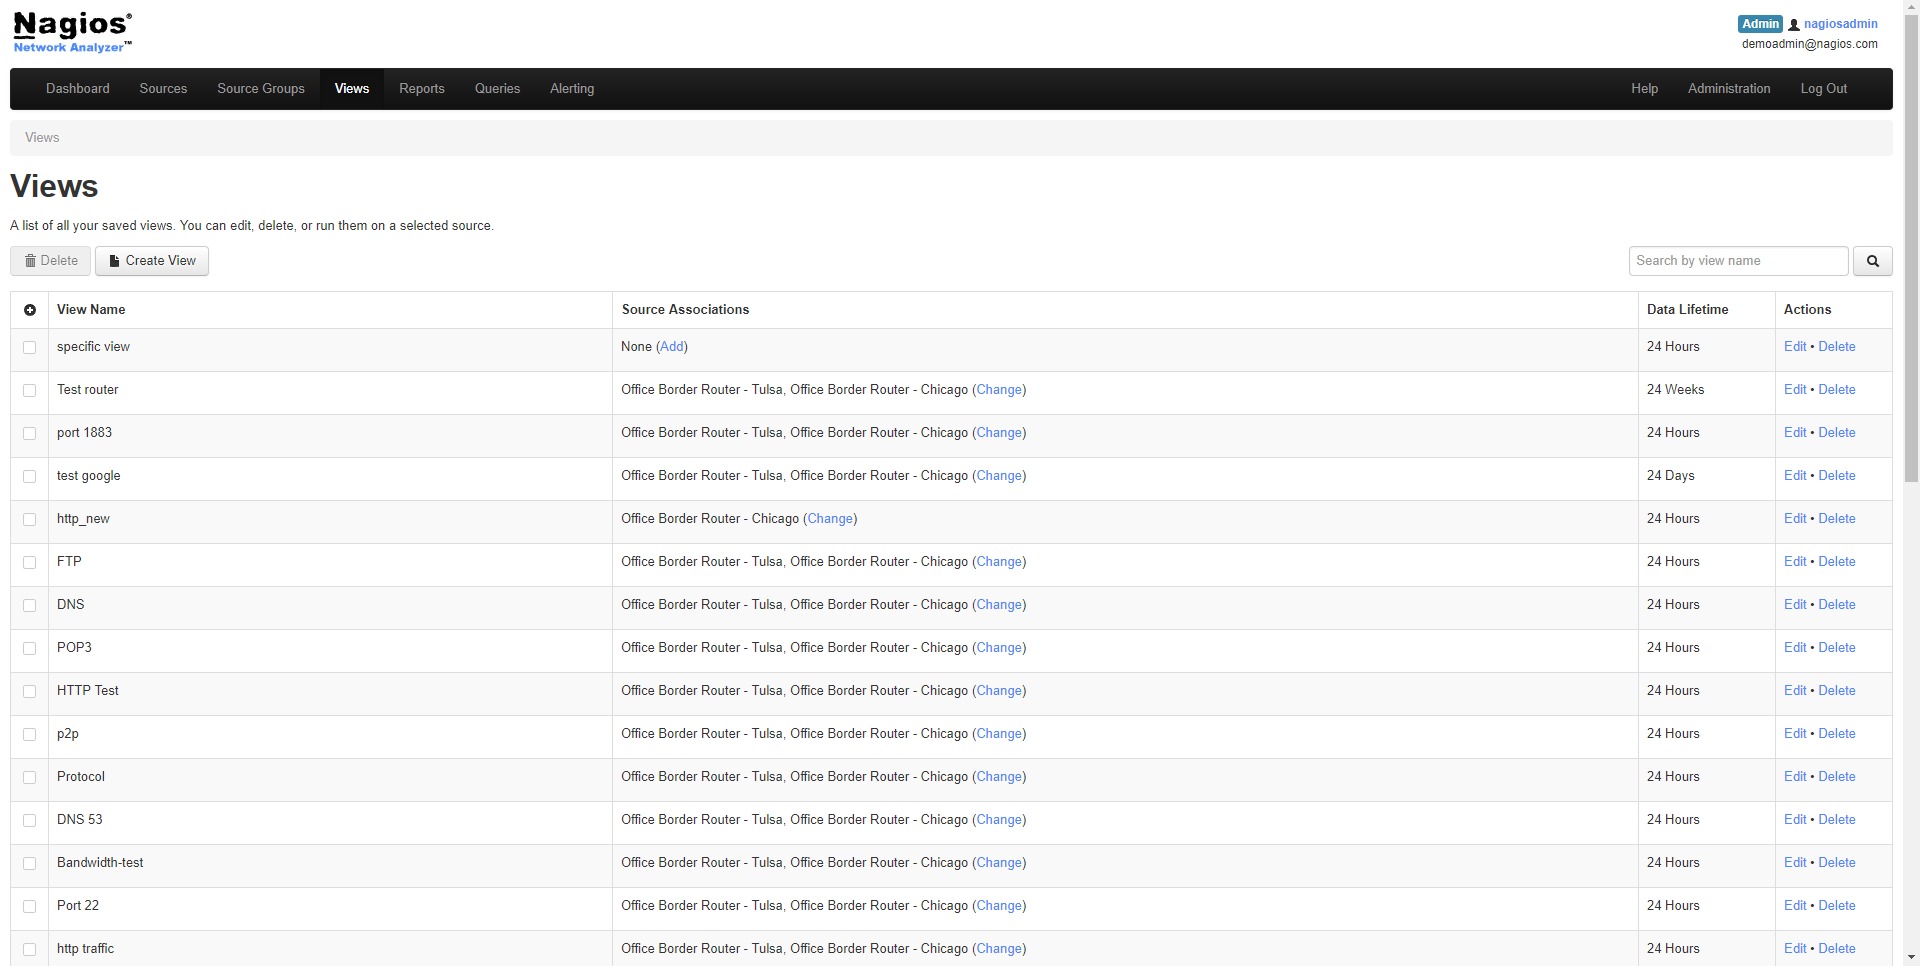
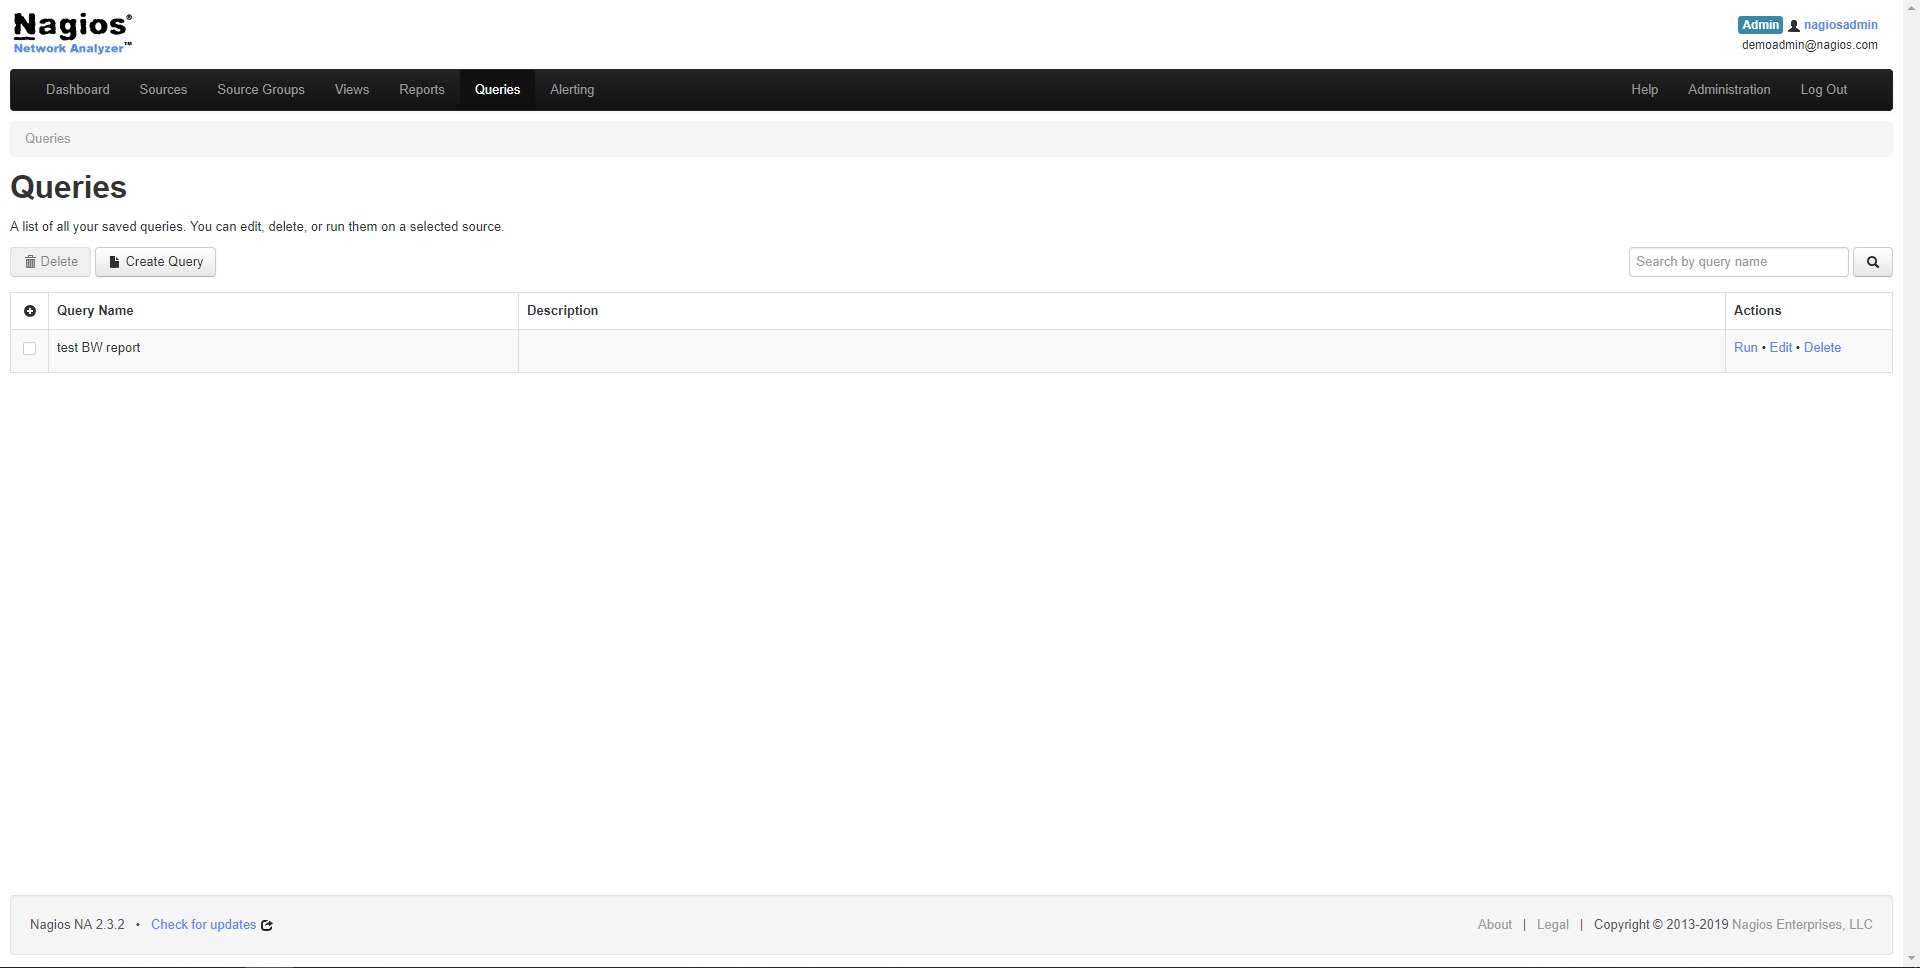
Users typically work with dashboards, traffic sources, flow data, reports, and alerts. The interface helps them move from a high-level traffic overview to more specific details, such as which host generated traffic, where it went, and how much bandwidth it used.
For experienced IT teams, the platform can become a practical daily monitoring cockpit. They can check top talkers, review alerts, compare traffic trends, investigate spikes, and prepare reports for operational decisions.
Nagios Network Analyzer is strongest in environments where network visibility matters every day: growing businesses, technical service providers, data-heavy companies, distributed offices, and organizations with internal IT teams responsible for stable infrastructure.

