
Geckoboard
Project management
E-commerce
Collaboration and personal effectiveness
Task manager
Analytics and monitoring
Languages:
English
Localization:
World
What is Geckoboard and how does it help teams?
Geckoboard is a real-time KPI dashboard platform designed to help teams monitor performance, align around goals, and make faster operational decisions. It brings metrics from multiple business tools into shared dashboards that make important numbers easy to see and understand. Instead of burying data inside reports, Geckoboard focuses on live visibility and turning metrics into something teams actively use.
The platform is often used by support teams, sales organizations, operations managers, SaaS businesses, and executives who need instant awareness of performance. Whether tracking support response times, revenue targets, marketing funnels, or operational health, Geckoboard helps centralize KPIs into one visual layer.
A major strength of the platform is simplicity. Dashboards can be built without heavy business intelligence expertise, while integrations help unify data from multiple systems. Its shared-screen dashboards also support a stronger performance culture by keeping goals visible in real time. For organizations struggling with scattered metrics, delayed reporting, or weak visibility, Geckoboard offers a practical way to make data more actionable.
What key features does Geckoboard offer?
Key Features
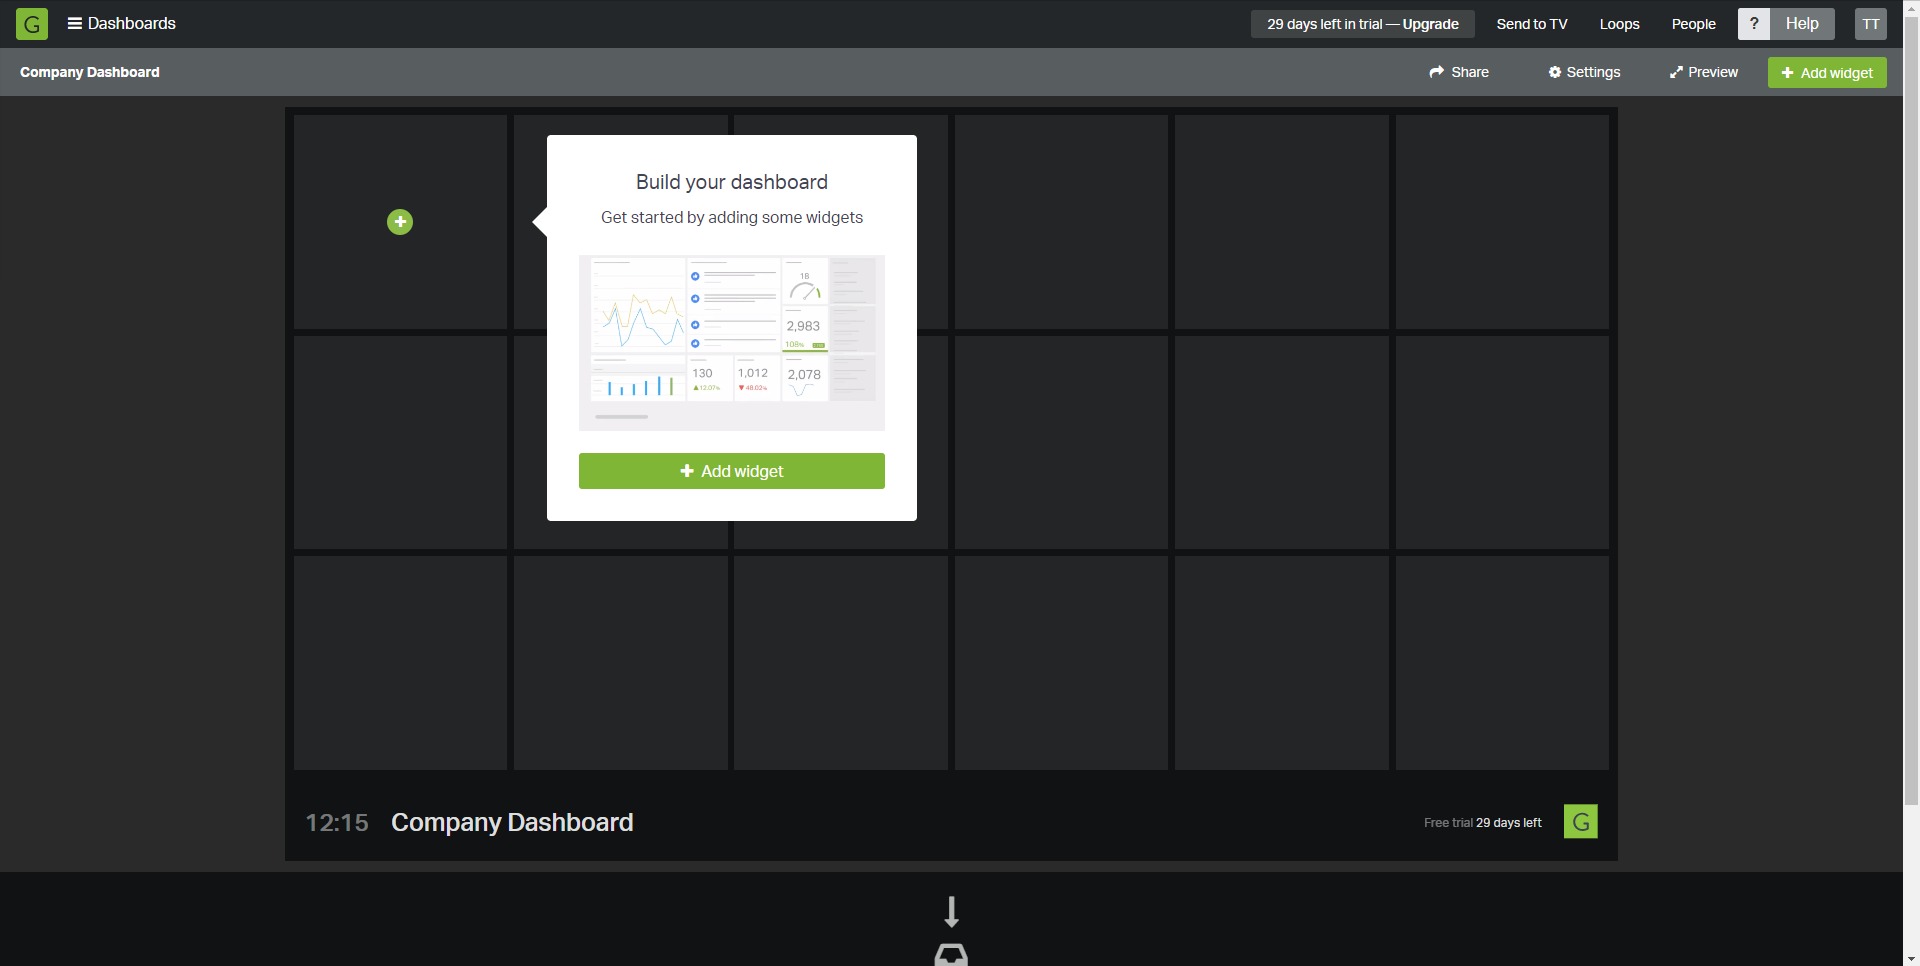
- Real-Time KPI Dashboards
Metrics update continuously, helping teams monitor performance as it happens rather than relying on delayed reports. - Dashboard Builder
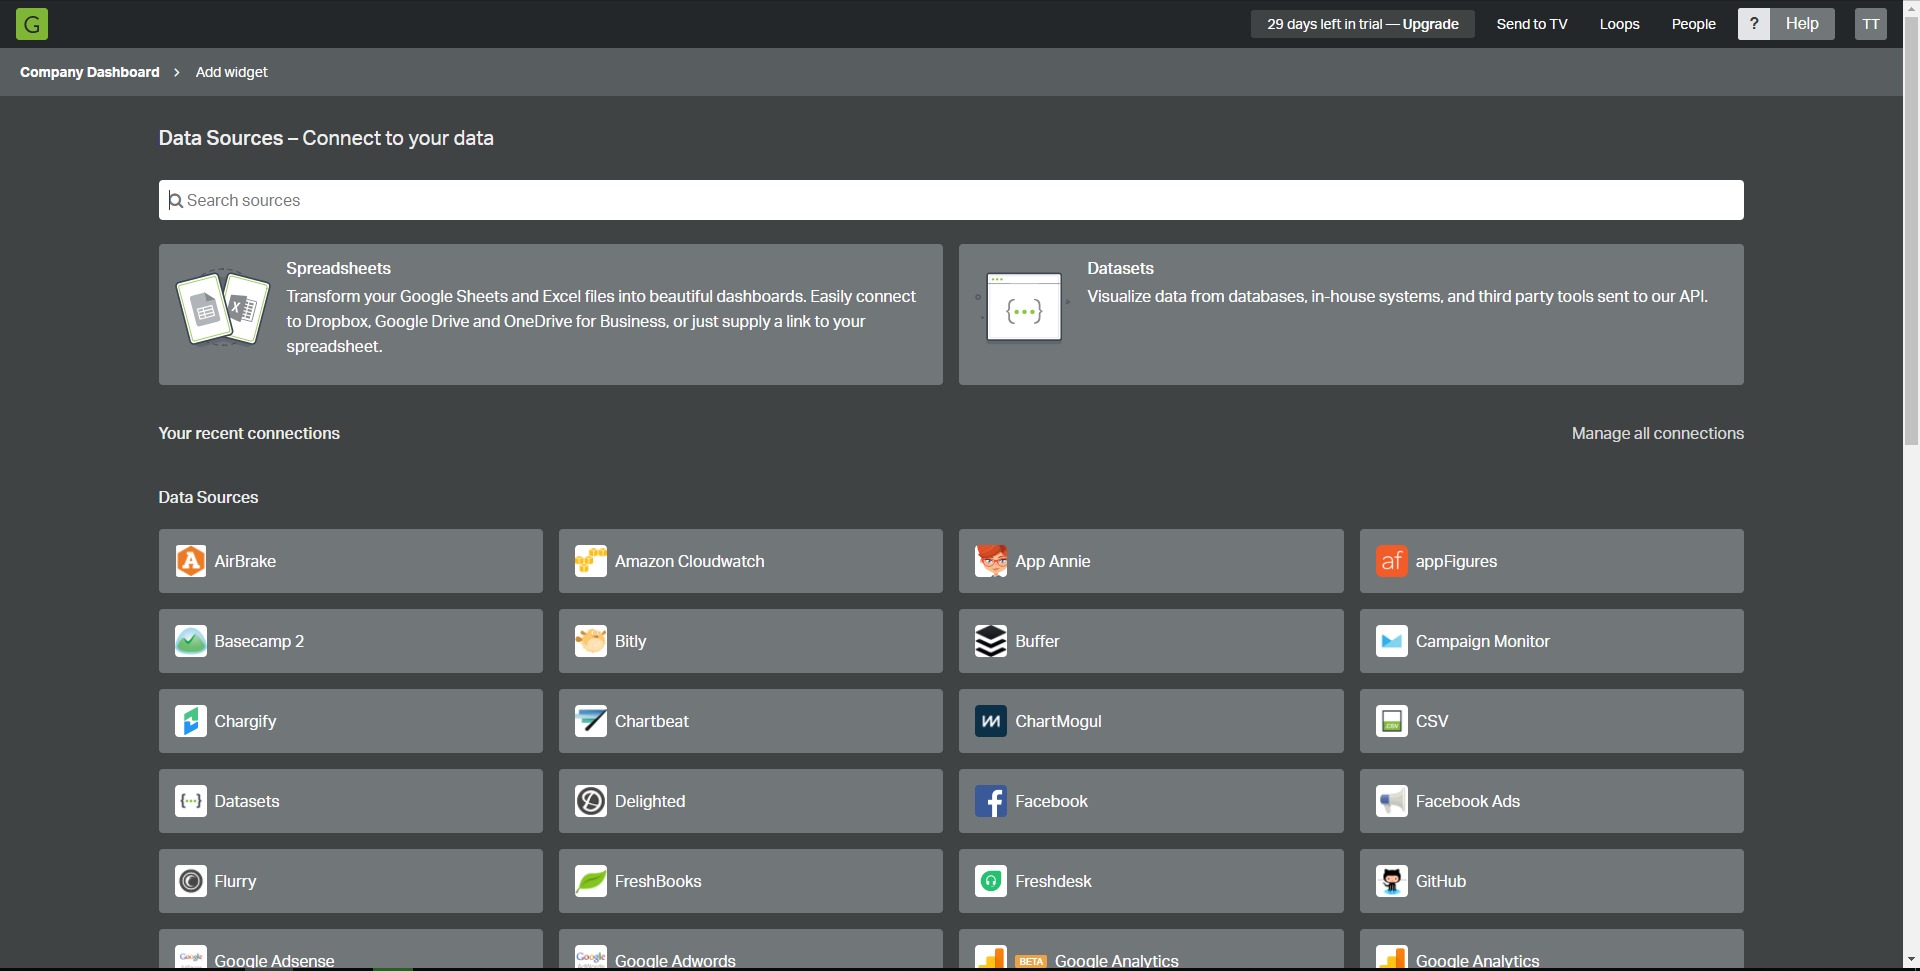
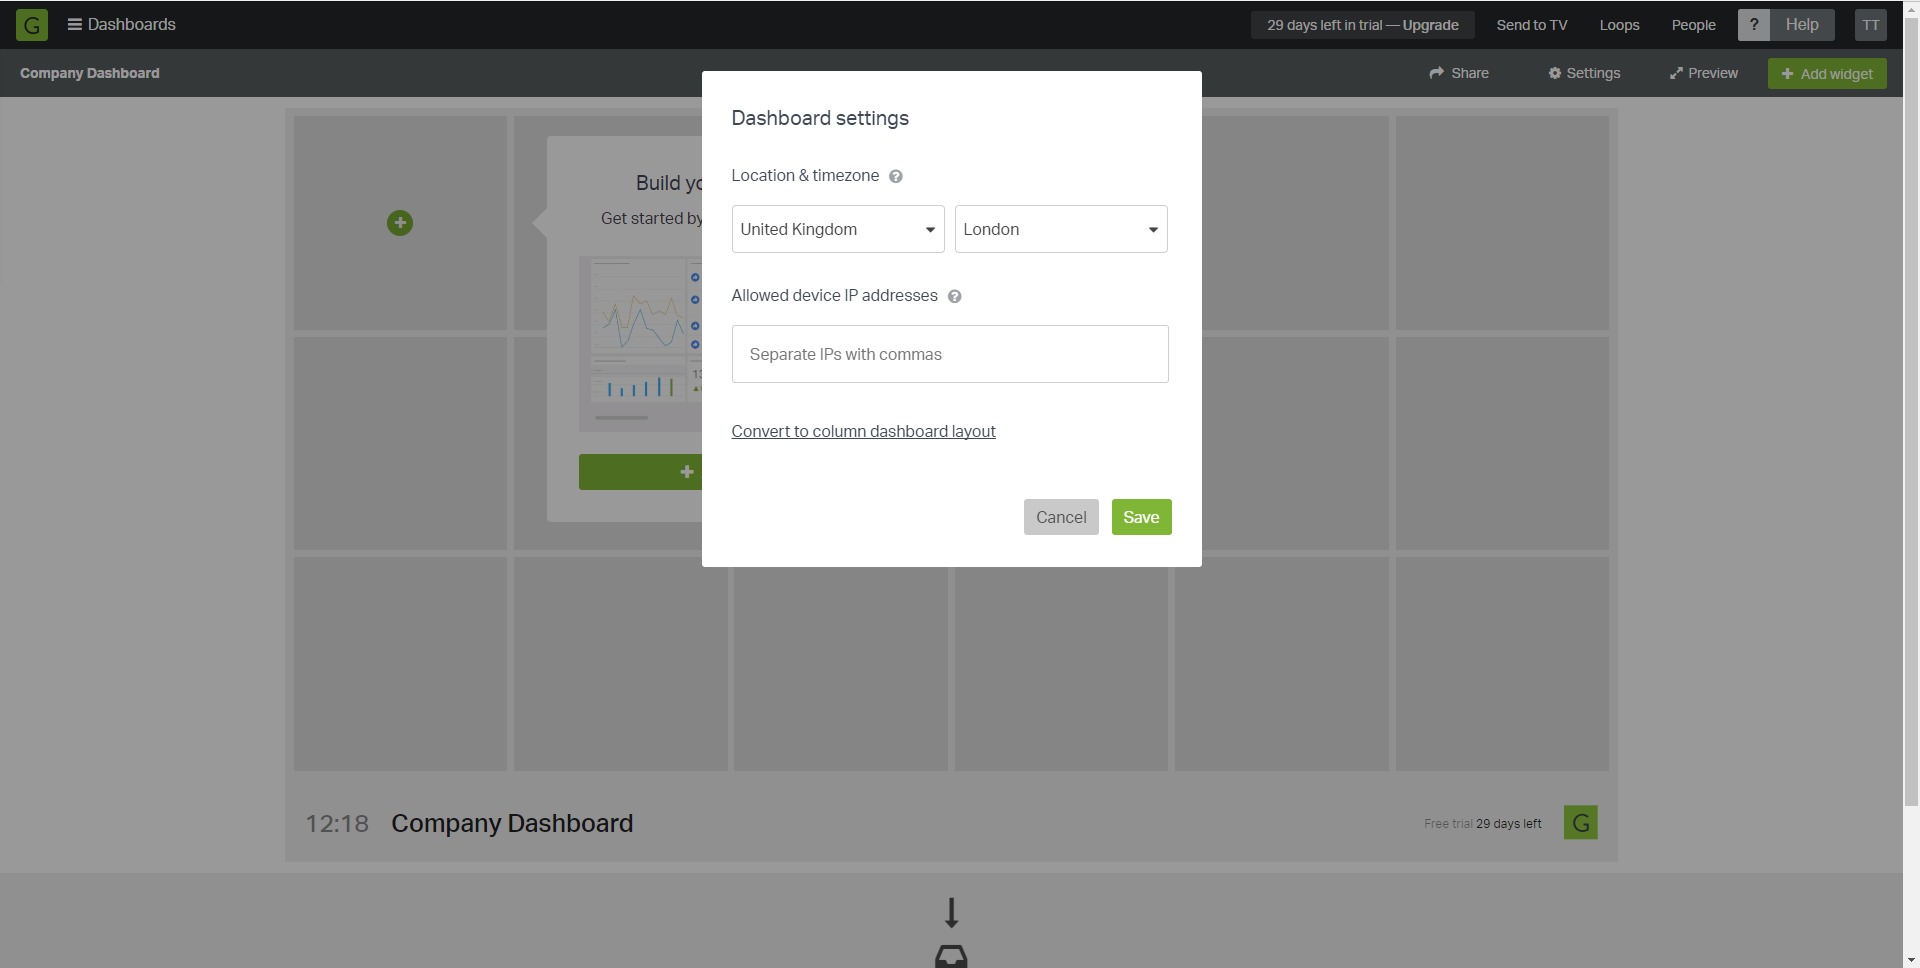
A flexible visual builder makes it easy to create dashboards tailored to departments, teams, or executive reporting needs. - Business Tool Integrations
Connects with CRM, support, analytics, databases, and spreadsheets to combine data sources into unified dashboards. - TV and Wallboard Dashboards
Dashboards can be displayed on shared screens in offices or remote team environments to keep performance visible. - Goal Tracking Widgets
Teams can compare progress against targets using visual indicators that make performance gaps easier to spot. - Team Performance Monitoring
Leaderboards, productivity metrics, and operational widgets support accountability and shared focus. - Custom Metrics and API Support
Businesses can track tailored KPIs beyond standard integrations using custom data sources. - Dashboard Sharing and Snapshots
Metrics can be shared across teams to improve transparency and communication.
What problems can Geckoboard solve?
Use Case Highlights
- Sales Performance Tracking
Monitor pipeline growth, conversions, quotas, and revenue performance in one place. - Customer Support Visibility
Track ticket volume, response times, backlog levels, and service-level targets in real time. - Marketing Performance Monitoring
Consolidate campaign metrics, traffic trends, leads, and funnel performance into live dashboards. - Operational Monitoring
Give operations teams immediate visibility into fulfillment, logistics, or process performance. - Executive KPI Reporting
Build simplified scoreboards for leadership without requiring complex BI reporting layers. - SaaS Metrics Tracking
Surface subscription growth, churn signals, MRR indicators, and customer health metrics. - DevOps and Service Monitoring
Use dashboards to monitor uptime, incident indicators, and technical performance metrics.
Why do businesses use Geckoboard?
Benefits
One major benefit is speed of visibility. Instead of waiting for weekly reports or manual exports, teams can react to live data as situations develop.
Another advantage is alignment across teams. Shared dashboards reduce confusion around priorities because everyone can see the same metrics and goals.
Geckoboard also supports better operational awareness. Many organizations have data but struggle to make it visible enough to influence decisions. The platform helps close that gap.
There is also value in simplicity versus traditional BI tools. For companies that do not need heavy analytics infrastructure, Geckoboard can deliver faster time to value with lower complexity.
For managers, the platform can improve accountability and focus by making targets measurable and progress transparent.
It can also contribute to stronger performance culture, where KPIs are not hidden in reports but become part of daily team behavior.
How easy is Geckoboard to use?
User Experience
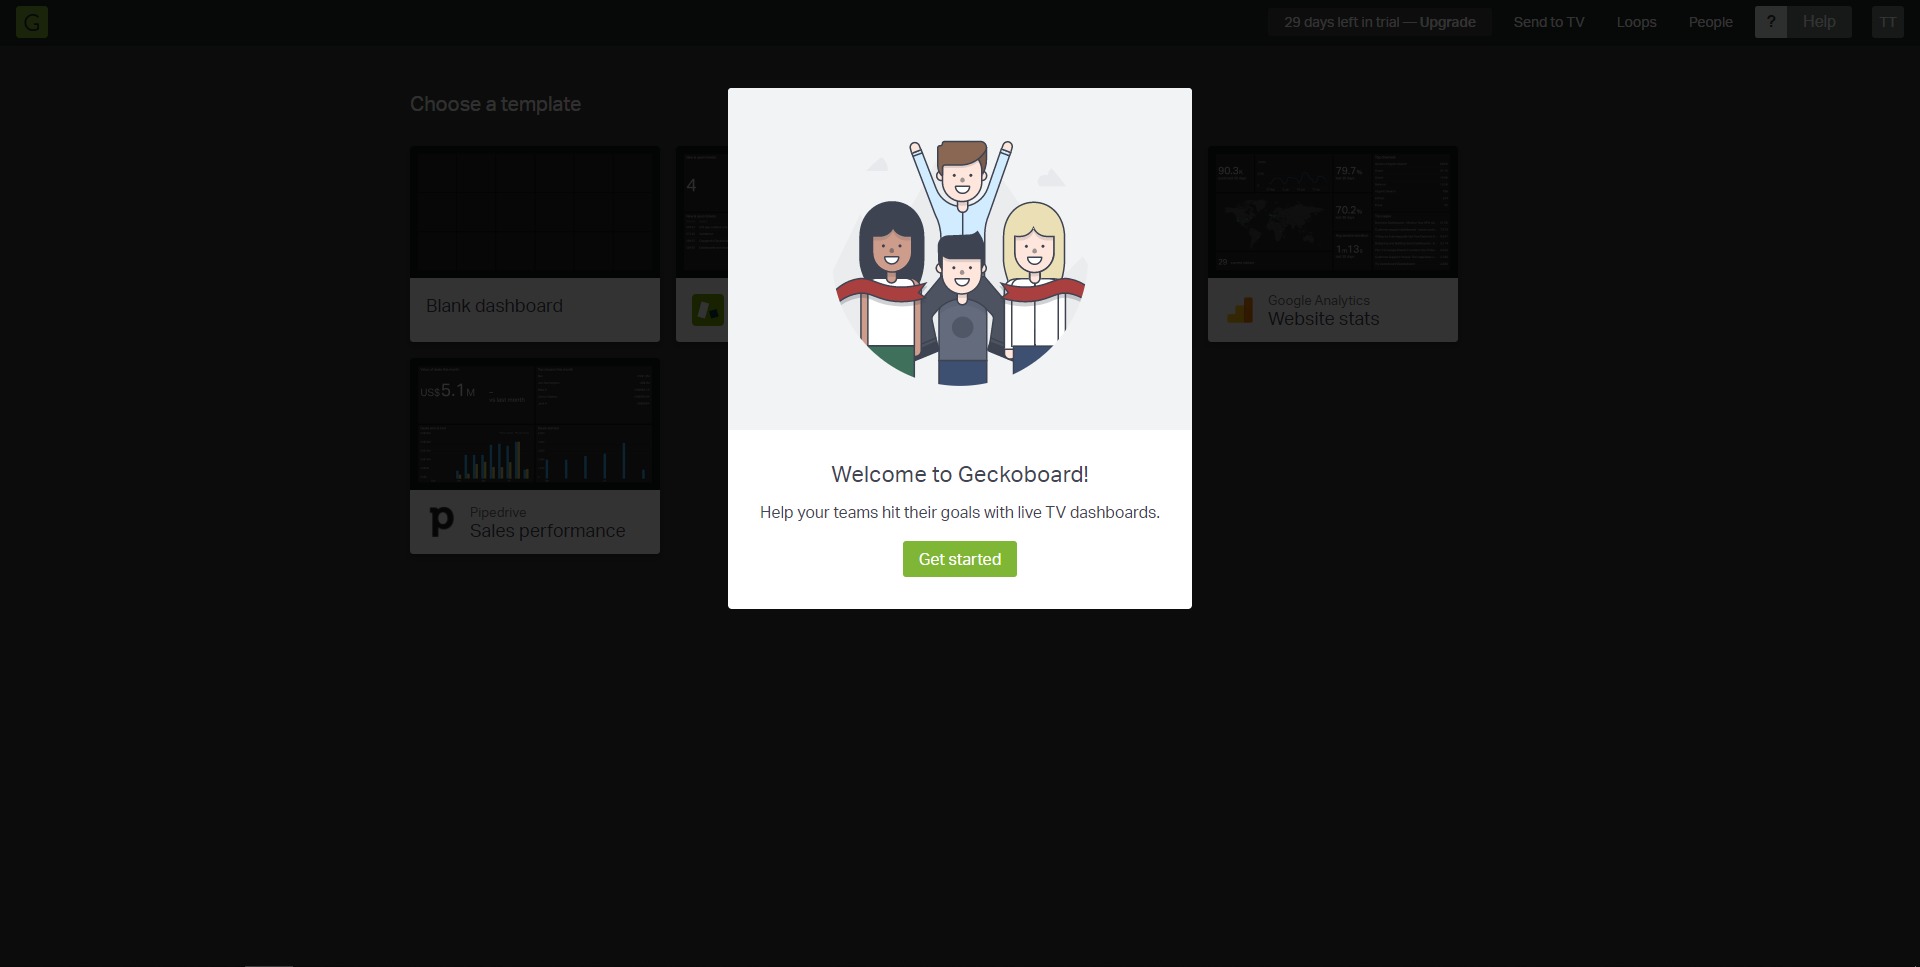
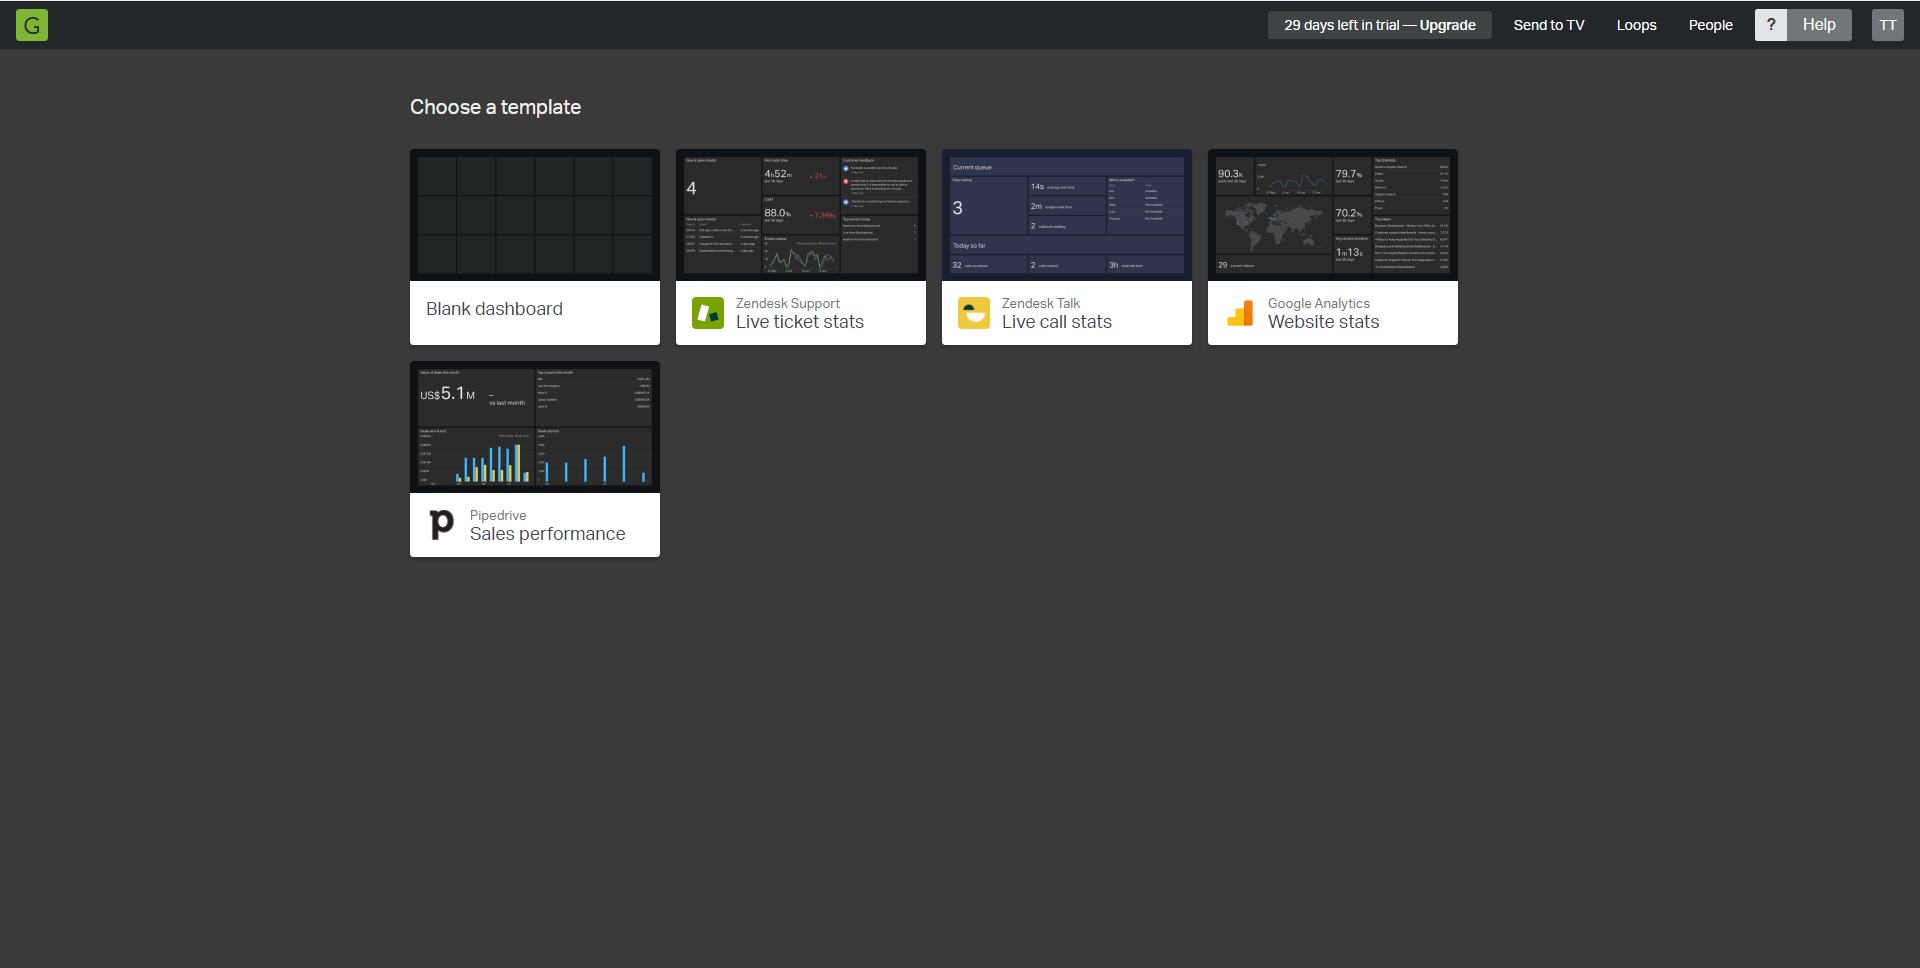
Geckoboard is generally positioned around ease of use. The interface focuses on building dashboards quickly without requiring specialized technical skills. Teams can often start with prebuilt data sources and customize from there.
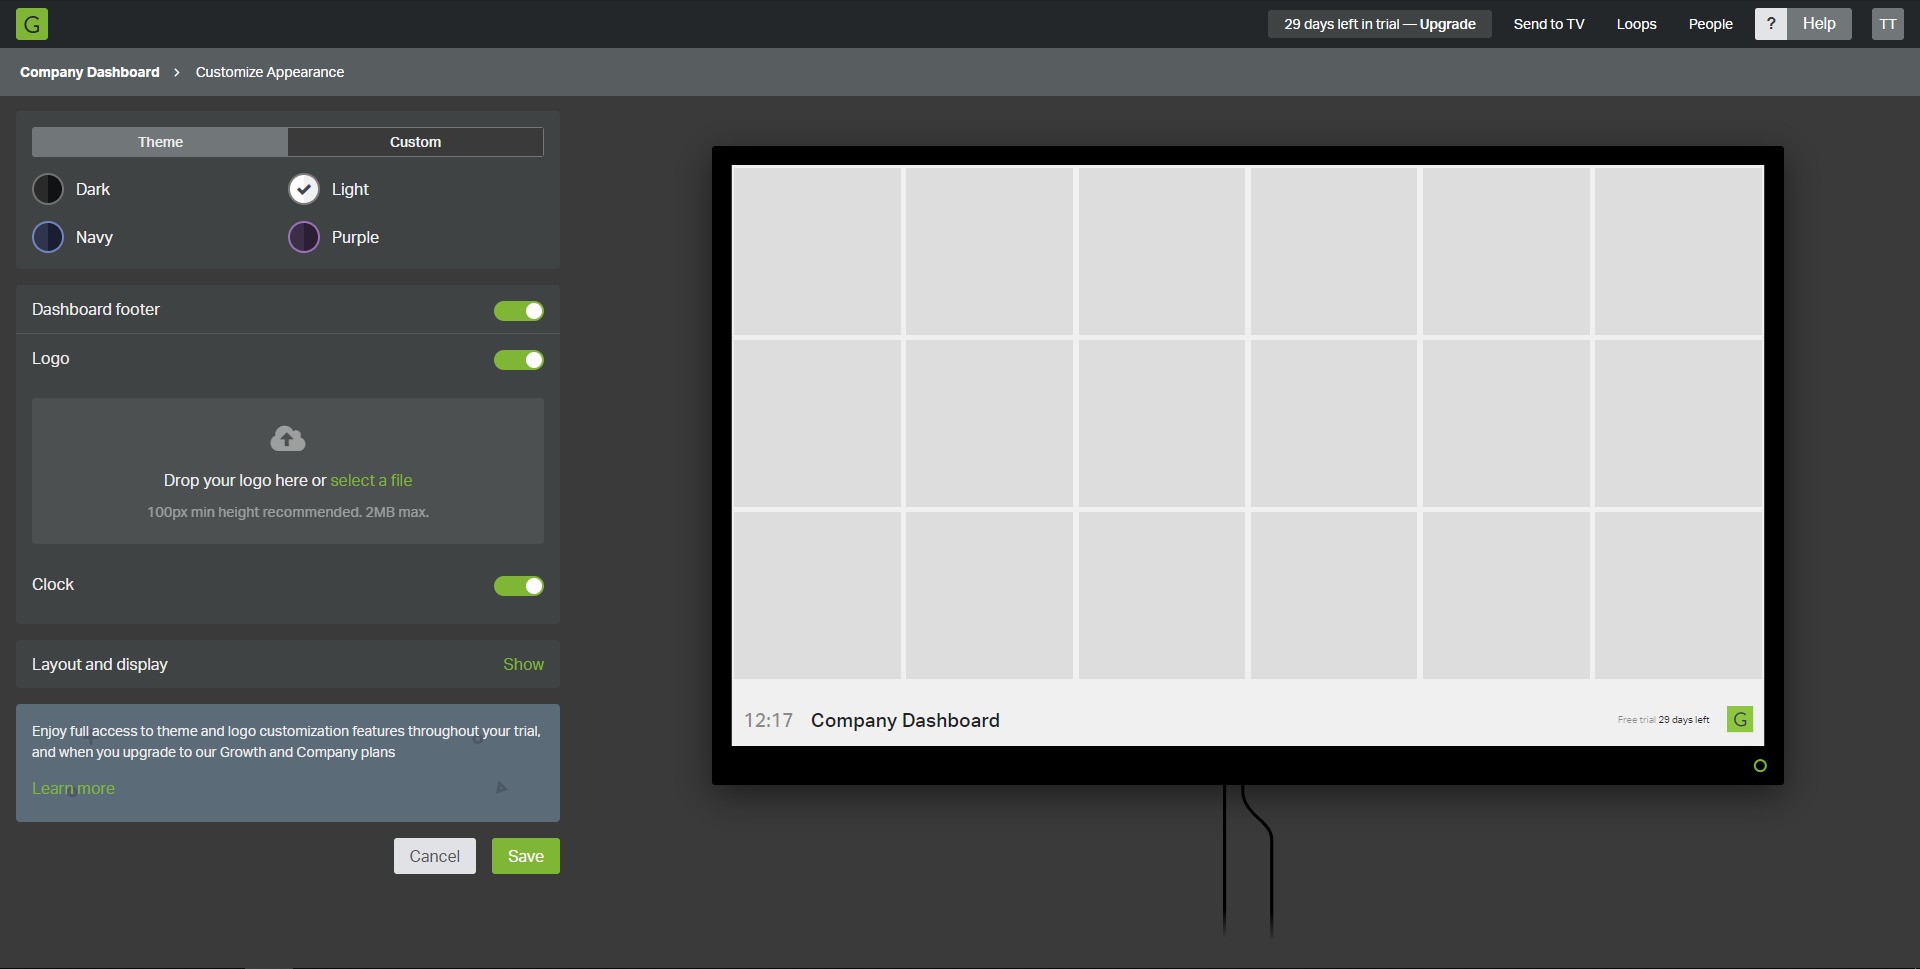
The visual design emphasizes clarity. Widgets are designed to make metrics easy to interpret at a glance, especially for shared-screen environments.
Navigation tends to support both individual dashboard use and broader team visibility, whether used on personal screens or office wallboards.
Another strength is the balance between simplicity and customization. Users can keep dashboards lightweight for quick monitoring or build more tailored KPI views as needs grow.
For many teams, the experience is less about analyzing data deeply and more about making sure important numbers stay visible and actionable.
Is Geckoboard a good fit for growing teams?
Geckoboard is often a strong fit for growing companies that need structure around metrics without adopting heavyweight enterprise analytics systems.
It tends to work well for:
- Startups building KPI discipline
- Scaleups managing cross-functional growth
- Support teams focused on response performance
- Revenue teams tracking live targets
- Operations teams needing shared visibility
Its value often increases as teams add tools and complexity, because dashboarding can reduce fragmentation across systems.
Organizations looking for advanced data science or heavy modeling may need complementary tools, but for live KPI visibility and operational dashboards, Geckoboard fits a distinct and useful category.
How does Geckoboard improve KPI management?
Geckoboard improves KPI management by shifting metrics from passive reporting into active operating signals.
Instead of KPIs living inside spreadsheets or monthly reviews, they become part of day-to-day execution.
That changes how teams respond:
- Problems surface earlier
- Trends become easier to spot
- Targets stay visible
- Decisions can happen faster
- Teams align around measurable outcomes
That is where real-time KPI dashboards move beyond reporting and become part of how teams operate. Geckoboard is built around exactly that idea.
2023-03-23 16:03:46: Check out how the sales and marketing team behind Pro handball club, Aalborg Håndbold, use their dashboards to align around shared goals.
https://t.co/7Xp50gTMgaTwitter
2023-03-08 16:41:37: If you need to visualize KPIs from a SQL database, then a live SQL dashboard is the perfect solution. Learn how in our new video:
https://t.co/BSwns4Wm9mTwitter
2022-12-15 13:14:11: Episode 4: Are you mapping your digital marketing metrics onto the wrong model?
In this new episode of Data Smarties, we take a look at the history of the marketing funnel so you can use it in a more strategic way.
https://t.co/pDKwNfhhSvTwitter
2022-11-08 11:45:34: TV dashboards can motivate your team, and keep everyone on the same page. Check out out new video tutorial on how to set up a TV dashboard
https://t.co/WP2fsAtWJNTwitter
2022-10-25 18:47:54: Read the full blog here: https://t.co/gJMEtxjUo4Twitter
2022-10-25 18:47:27: 5. "Our temps didn’t know what they were doing” – keep track of your team with a dashboard. Now, more experienced members of the team can jump into help newer members who might be struggling. https://t.co/C82LsRgplMTwitter
2022-10-25 18:46:23: 4. "We didn’t realize we ran out of stock”– Fulfilment is the backbone of any successful retail or ecommerce operation. Keep track of stock with an inventory dashboard. https://t.co/VtNX4Pez0oTwitter
2022-10-25 18:45:32: 3."We ran out of ad budget too early’ / ‘We didn’t spend all our ad budget” – don’t leave marketing budget (and revenue opportunities) on the table. Track ad spend with our integrations for Google Ads, Facebook, and Instagram. https://t.co/GThXPDouv0Twitter
2022-10-25 18:43:56: 2. "We took too long to respond to all the customer queries” – if customer support tickets build up, you need to be all over that in a flash. Track Support metrics on a TV dashboard with our Zendesk integration. https://t.co/9FQcjsYbWpTwitter
2022-10-25 18:42:42: 1. "A webpage broke and we didn’t notice” – if your website is down, you’re losing money. It’s as simple as that. Track website health metrics with our Google Analytics integration. https://t.co/XEOc6mzGnvTwitter