
Tableau
Languages:
English
Localization:
World
Tableau is a leading business intelligence (BI) and data visualization software that empowers organizations to make data-driven decisions. Known for its intuitive interface and robust capabilities, Tableau simplifies the complex process of data analysis, making it accessible to users of all skill levels. Founded in 2003, Tableau was acquired by Salesforce in 2019, further enhancing its capabilities through integration with Salesforce's cloud-based CRM platform.
Overview of Tableau
Tableau is designed to help users see and understand their data through interactive, visual analysis. The platform offers a range of tools for data preparation, visualization, and sharing, catering to various industries and use cases. Tableau's mission is to help people make informed decisions quickly and confidently by providing powerful, easy-to-use tools for exploring and analyzing data.
Tableau's user-centric approach allows for the creation of dynamic, shareable dashboards that provide actionable insights. It supports a wide range of data sources, from spreadsheets to cloud-based databases, enabling seamless integration into existing workflows. With its focus on interactivity, Tableau enables users to drill down into data, ask questions, and uncover trends without the need for complex coding.
Main Features of Tableau
-
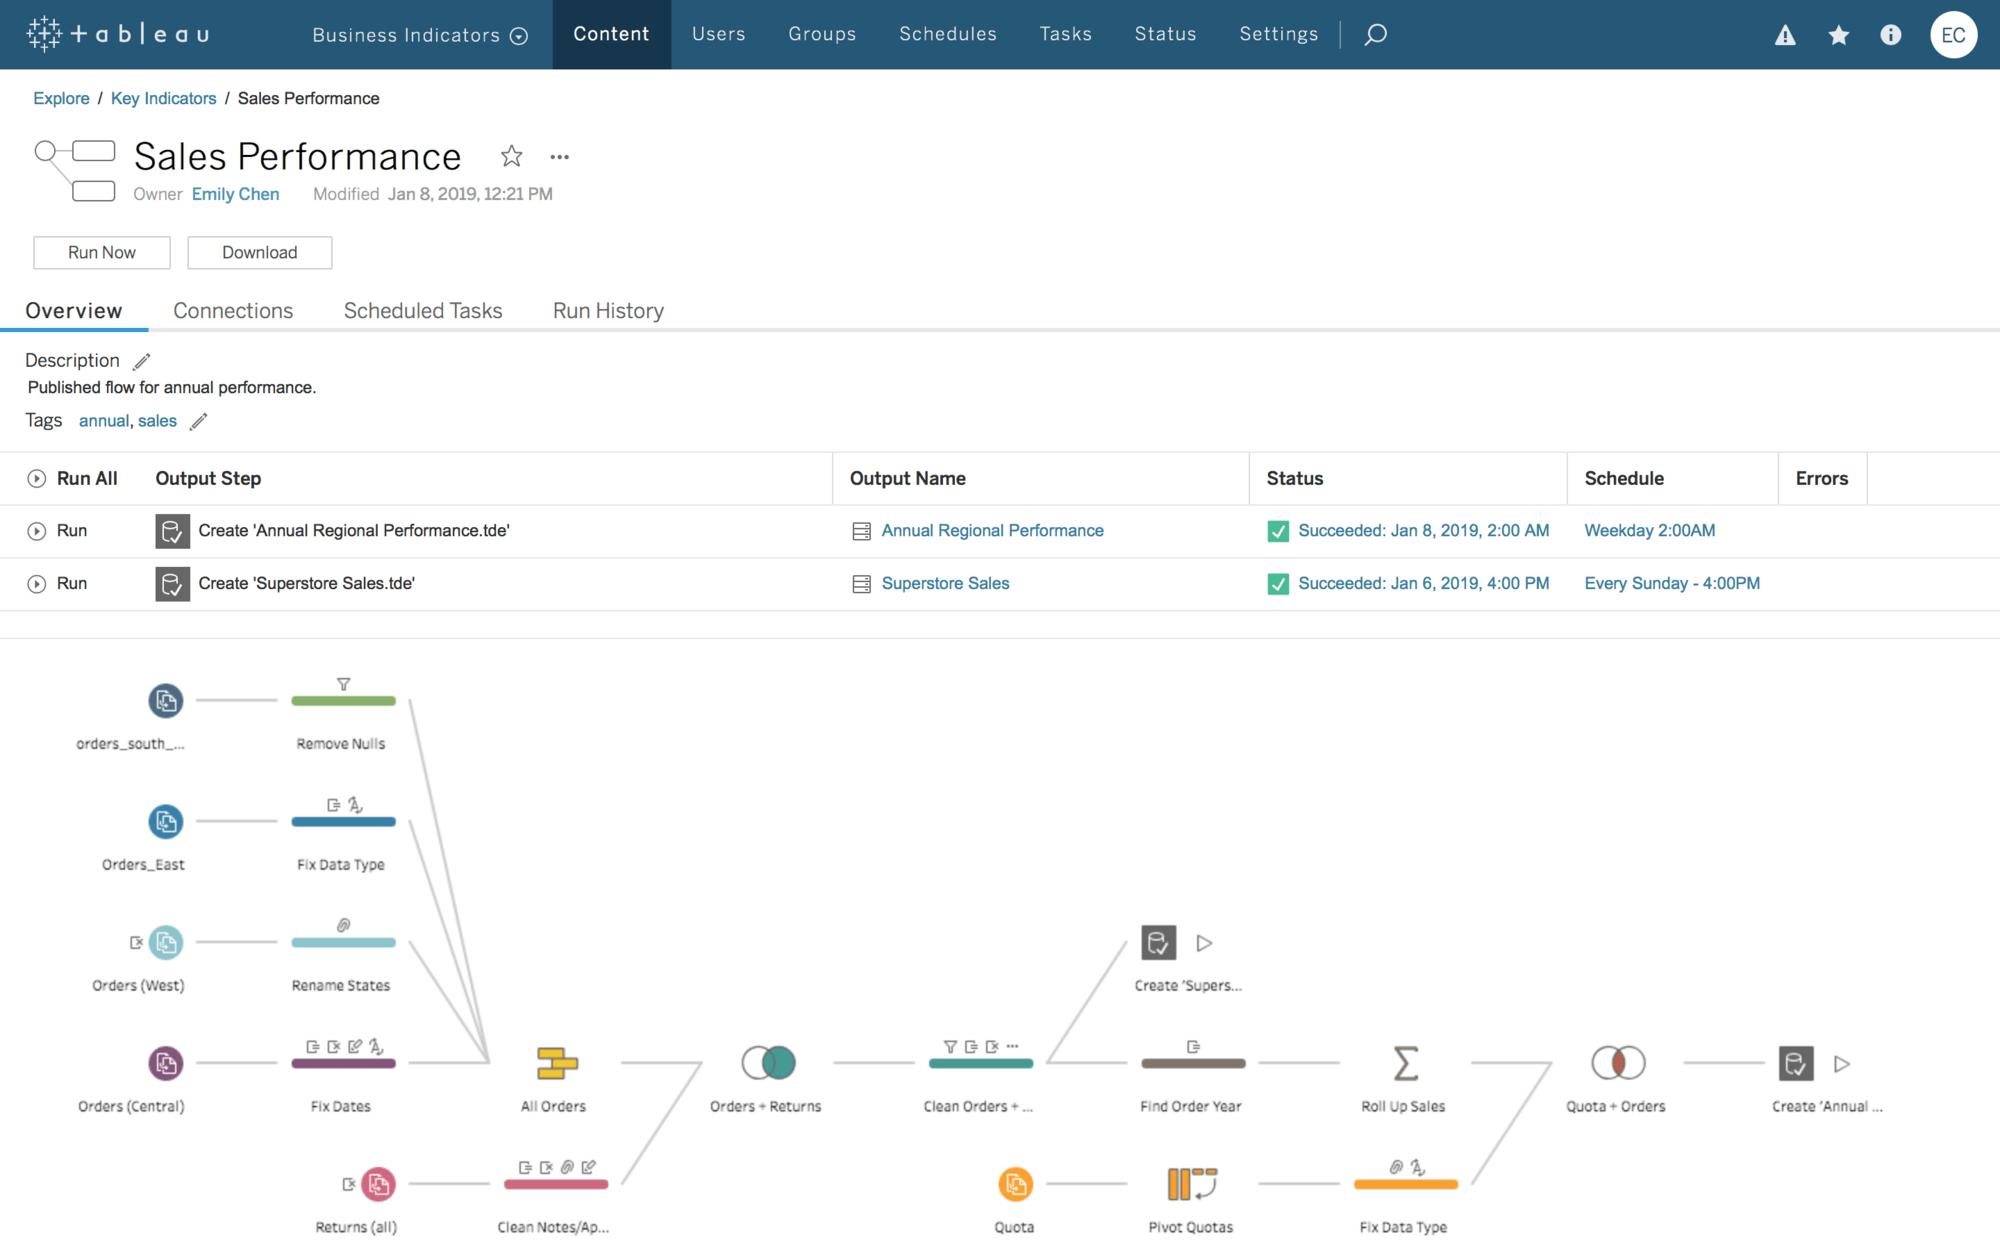
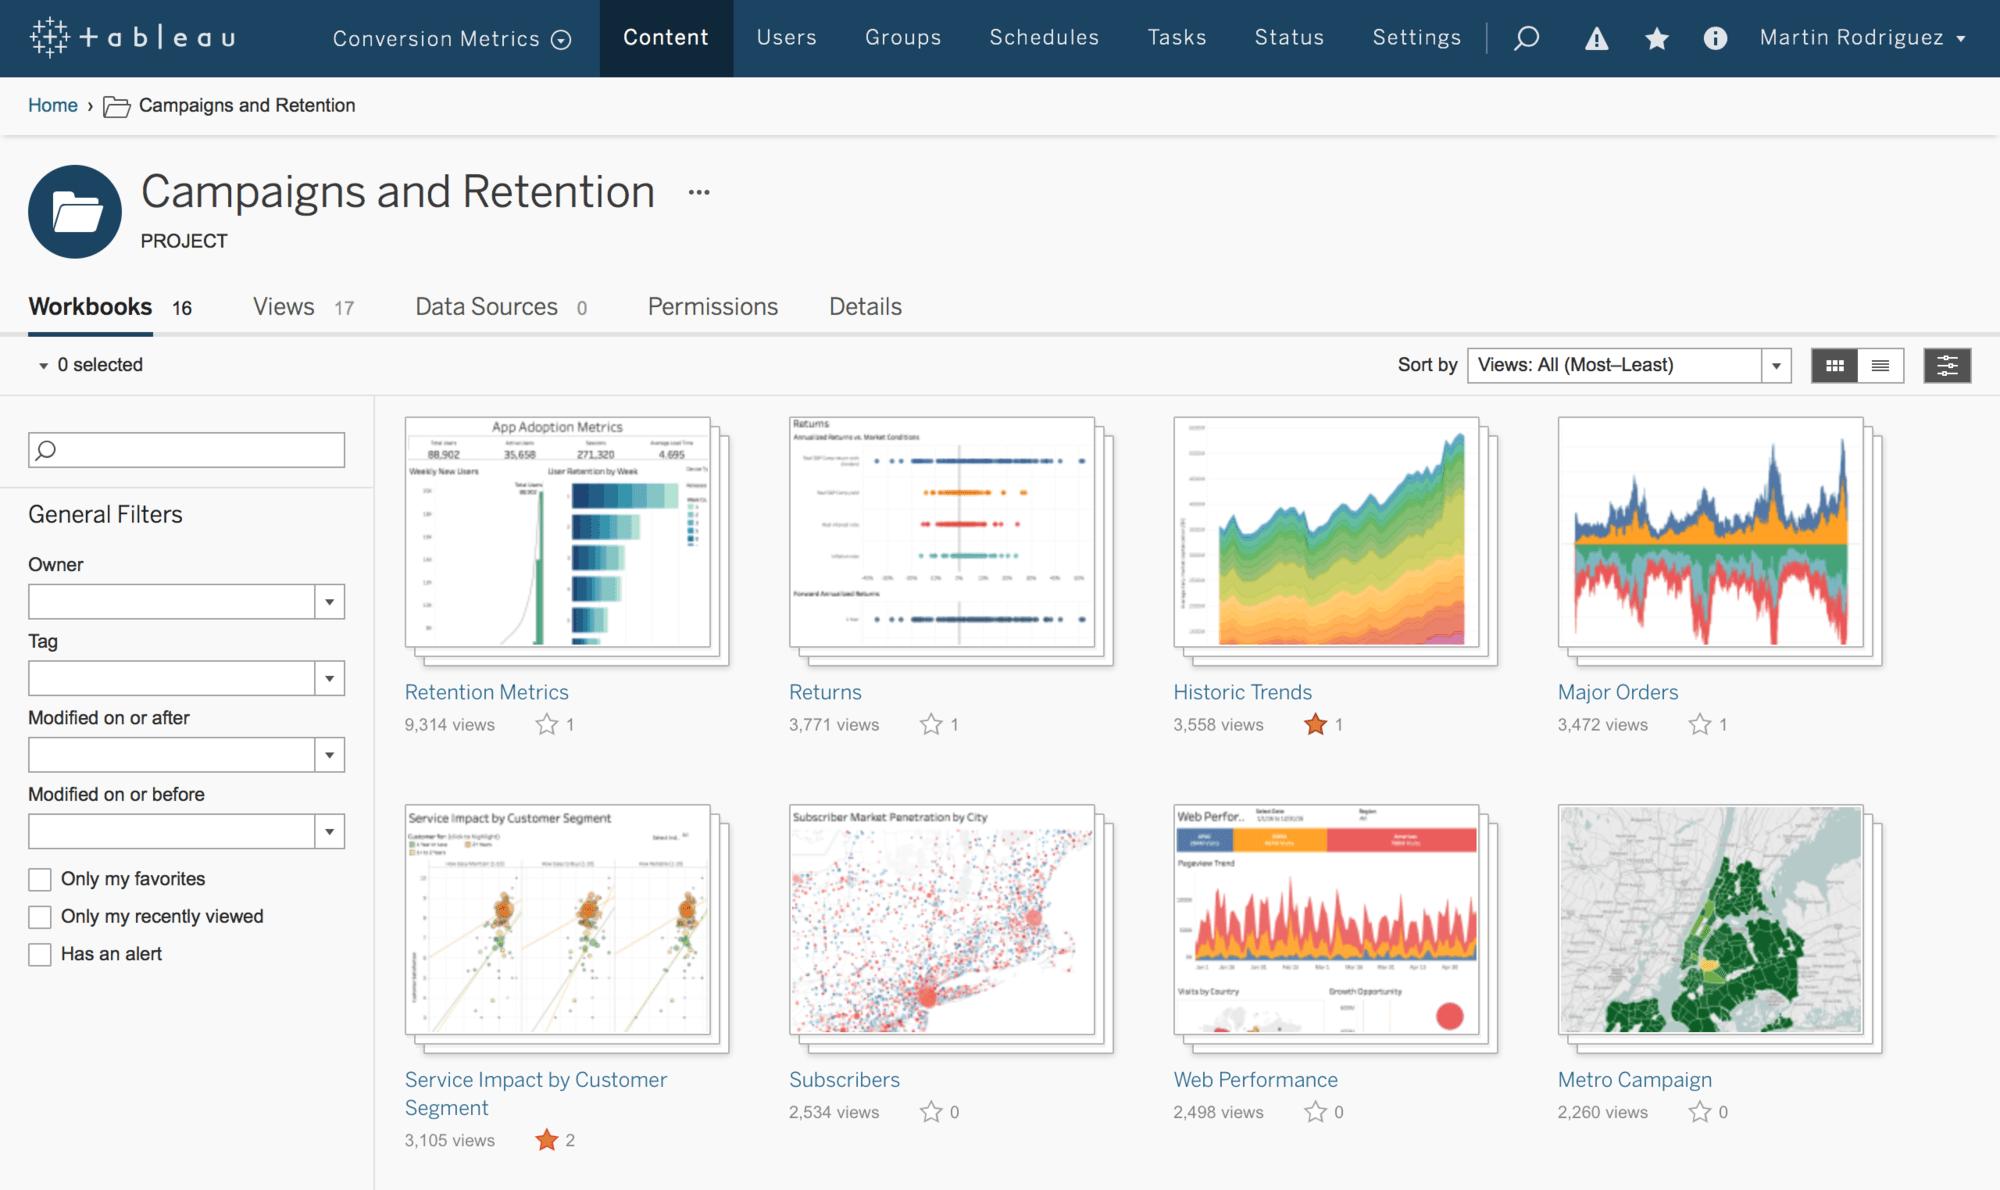
Interactive Dashboards:
- Create visually rich dashboards that combine multiple data views.
- Interactive elements like filters, tooltips, and highlights allow users to explore data intuitively.
- Dashboards can be shared and embedded within websites or other applications.
-
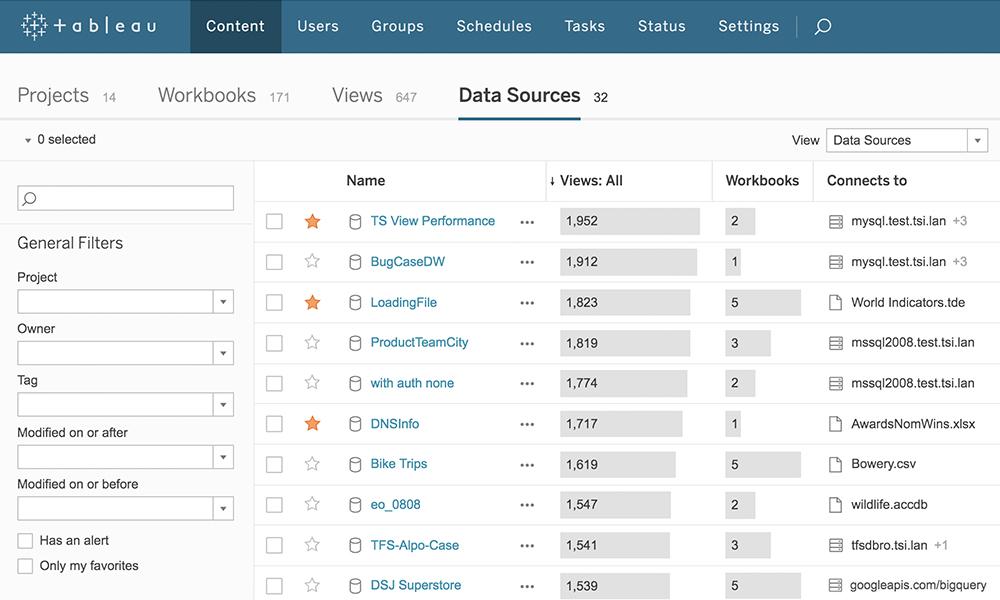
Data Connectivity:
- Connect to a wide range of data sources, including spreadsheets, databases, cloud services, and big data platforms.
- Integrate with Salesforce for real-time CRM data visualization.
-
Advanced Visualizations:
- Offers various chart types such as bar, line, scatter plots, and heat maps.
- Geospatial analysis with map visualizations, allowing for geographic data representation.
- Allows custom visualizations through extensions and JavaScript API.
-
Data Preparation:
- Tableau Prep provides tools for cleaning, shaping, and combining data before analysis.
- Includes features like data profiling, automatic data cleaning suggestions, and data sampling.
-
Analytics and Calculations:
- Provides built-in analytics tools like trend analysis, forecasting, and statistical modeling.
- Users can create custom calculations and scripts using Tableau's calculated fields and R integration.
-
Collaboration and Sharing:
- Share insights via Tableau Server, Tableau Online, or Tableau Public.
- Collaborate on data projects with colleagues through shared workspaces and commenting.
-
Mobile Access:
- Optimized for mobile devices, allowing users to access and interact with dashboards on-the-go.
- Supports responsive design, ensuring a consistent experience across different devices.
-
Embedded Analytics:
- Embed Tableau visualizations into existing applications or web pages.
- Provides APIs for integration and customization to fit business needs.
-
Security and Governance:
- Features role-based access control, data encryption, and activity logging.
- Supports compliance with industry standards and regulations, ensuring data security and privacy.
-
AI and Machine Learning:
- Leverages AI capabilities through Tableau's integration with Salesforce Einstein.
- Provides AI-driven insights, automated analysis, and natural language processing for querying data.
-
Extensive Support and Community:
- Offers extensive resources including training materials, forums, and customer support.
- Active community of users and developers contributing to the ecosystem with extensions, connectors, and knowledge sharing.
-
Scalability:
- Suitable for individual analysts to large enterprises.
- Offers deployment options that scale with the organization’s needs, from on-premises to cloud-based solutions.
Benefits of Using Tableau
- User-Friendly: Tableau's drag-and-drop interface makes it easy for users to create complex visualizations without extensive technical skills.
- Fast Deployment: Quick to set up and integrate, allowing organizations to start deriving value from their data promptly.
- Customizable: Flexible enough to meet diverse analytical needs through customization and third-party integrations.
- Scalable: Scales with organizational needs, accommodating growing data volumes and user bases.
- Robust Community and Support: Backed by a strong community and comprehensive support resources, making it easier for users to find solutions and best practices.
2025-12-19 09:31:38: 🔴Live Youtube
2025-12-19 06:47:38: View the subsequent content through the homepage link#usa #shortsvideo #newyork Youtube
2025-12-19 06:46:57: View the subsequent content through the homepage link#usa #shortsvideo #newyork Youtube
2025-12-19 04:13:13: View the subsequent content through the homepage link#usa #shortsvideo #newyork Youtube
2025-12-18 15:57:09: View the subsequent content through the homepage link#usa #shortsvideo #newyork Youtube
2025-12-18 15:56:17: View the subsequent content through the homepage link#usa #shortsvideo #newyork Youtube
2025-12-18 13:54:15: https://sites.google.com/view/smartplayerprivacypolicy/home#h.qbd0rjyr8unk Youtube
2025-12-18 12:15:55: View the subsequent content through the homepage link#usa #shortsvideo #newyork Youtube
2025-12-18 12:15:15: View the subsequent content through the homepage link#usa #shortsvideo #newyork Youtube
2025-12-18 07:21:55: Powerfull Website you should know #Shorts#WebsiteTips #WebDesignInspiration #DigitalMarketingAdvice Youtube
2023-04-03 18:01:24: Chart your course to success at Tableau Conference #Data23. 📊
https://t.co/YhGcqxZf7B https://t.co/izCZJhAaFJTwitter
2023-04-02 18:00:17: Do you know your organization's Environmental, Social, and Governance (ESG) score? 🌱 🌎 🤝
The Tableau Accelerator for ESG allows you to see where your company stands in terms of sustainability, diversity in the workplace, and more: https://t.co/x0GmyaQBWP https://t.co/hCtLBSBtF9Twitter
2023-03-31 22:00:35: Who else is counting down to Tableau Conference?
Snap a selfie in the virtual photo booth and share your excitement! #Data23
📸: https://t.co/GonSeZSffp https://t.co/cWs4zgsIx0Twitter
2023-03-31 20:13:13: Learn, connect, and get inspired by the latest in Tableau Community content. The latest #DataFam Roundup is live: https://t.co/pwlQHYUdSv https://t.co/uxvFmBEppkTwitter
2023-03-30 23:02:20: Level up your data skills with hands-on projects!
Join community-led sessions LIVE at Tableau Conference with #MakeoverMonday, #WorkoutWednesday, Back 2 Viz Basics #B2VB, #PreppinData, and more.
Add these to your favorites in the session catalog: https://t.co/xYKa77haan #Data23 https://t.co/OP7SqhQ9YJTwitter
2023-03-29 23:08:11: Take charge of your analytics strategy with Tableau Blueprint, a proven methodology to scale data use and build a data-driven organization.
Ready to transform your organization? Take the Tableau Blueprint Assessment. https://t.co/u4gbaVscTb https://t.co/GiDOiXtU4yTwitter
2023-03-29 23:06:51: 3. Measure impact.
From improved operational efficiencies to increased revenue—identify key metrics to show how investing in data governance leads to a positive impact.Twitter

