
Klipfolio
Languages:
Deutsch
English
Español
Français
Portuguese
Русский
Localization:
World
What is Klipfolio Dashboards And Metrics Platform?
Klipfolio Dashboards And Metrics Platform is a cloud-based business intelligence solution designed to turn scattered data into live, visual, and easy-to-share insights. It focuses on two core ideas: real-time dashboards for everyday monitoring and a structured metrics layer to keep everyone aligned on the same definitions of key numbers.
Instead of manually updating spreadsheets or preparing static slide decks, teams connect their data sources once and let Klipfolio handle ongoing refresh and visualization. Marketing, sales, finance, and operations can all plug in their tools, define standard KPIs, and track performance from a single, always-on hub.
The platform is built for modern, distributed teams that need fast answers more than complex infrastructure. It gives analysts enough flexibility to model and transform data while still being usable for non-technical users who just want to understand trends, spot issues, and share dashboards with colleagues or clients.
What key features does Klipfolio provide?
-
Data connections to popular tools
Klipfolio connects to a wide range of cloud apps, databases, spreadsheets, and APIs. This allows teams to pull in CRM data, ad spend, web analytics, financial figures, and operational metrics into one place without endless importing and exporting. -
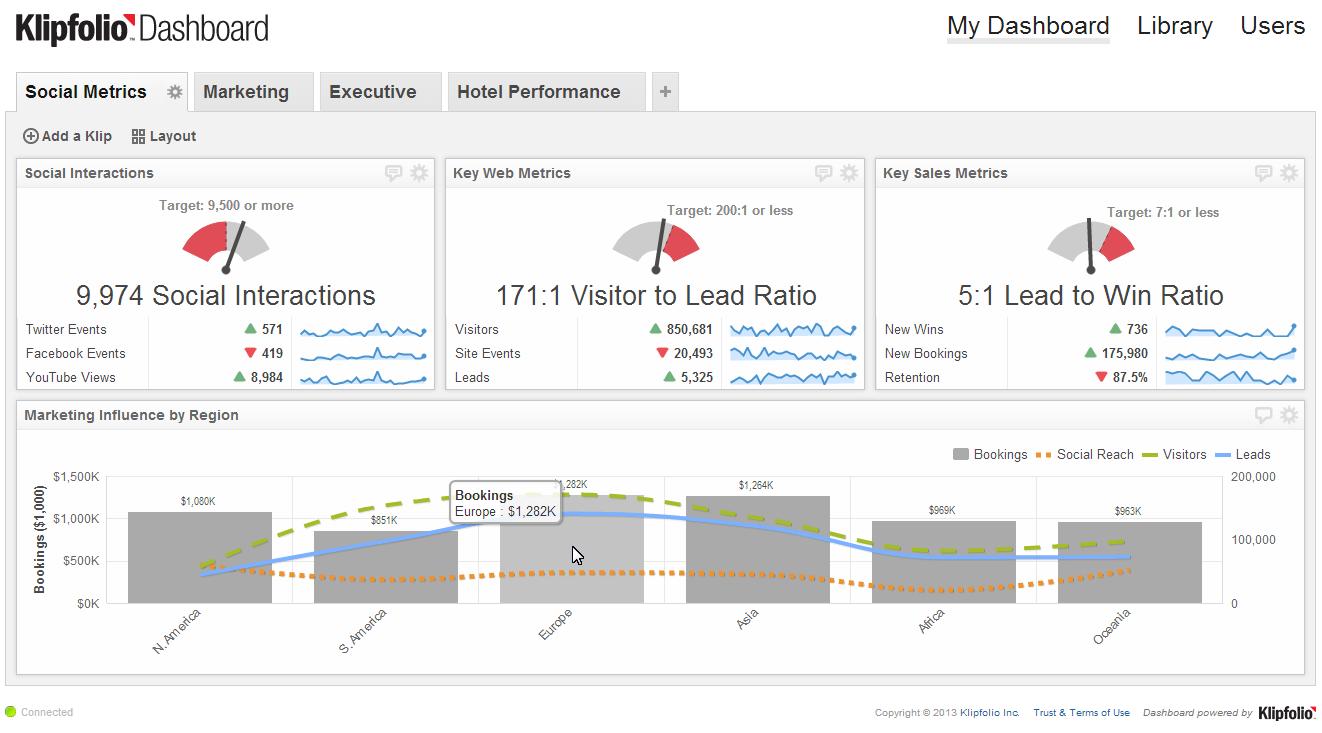
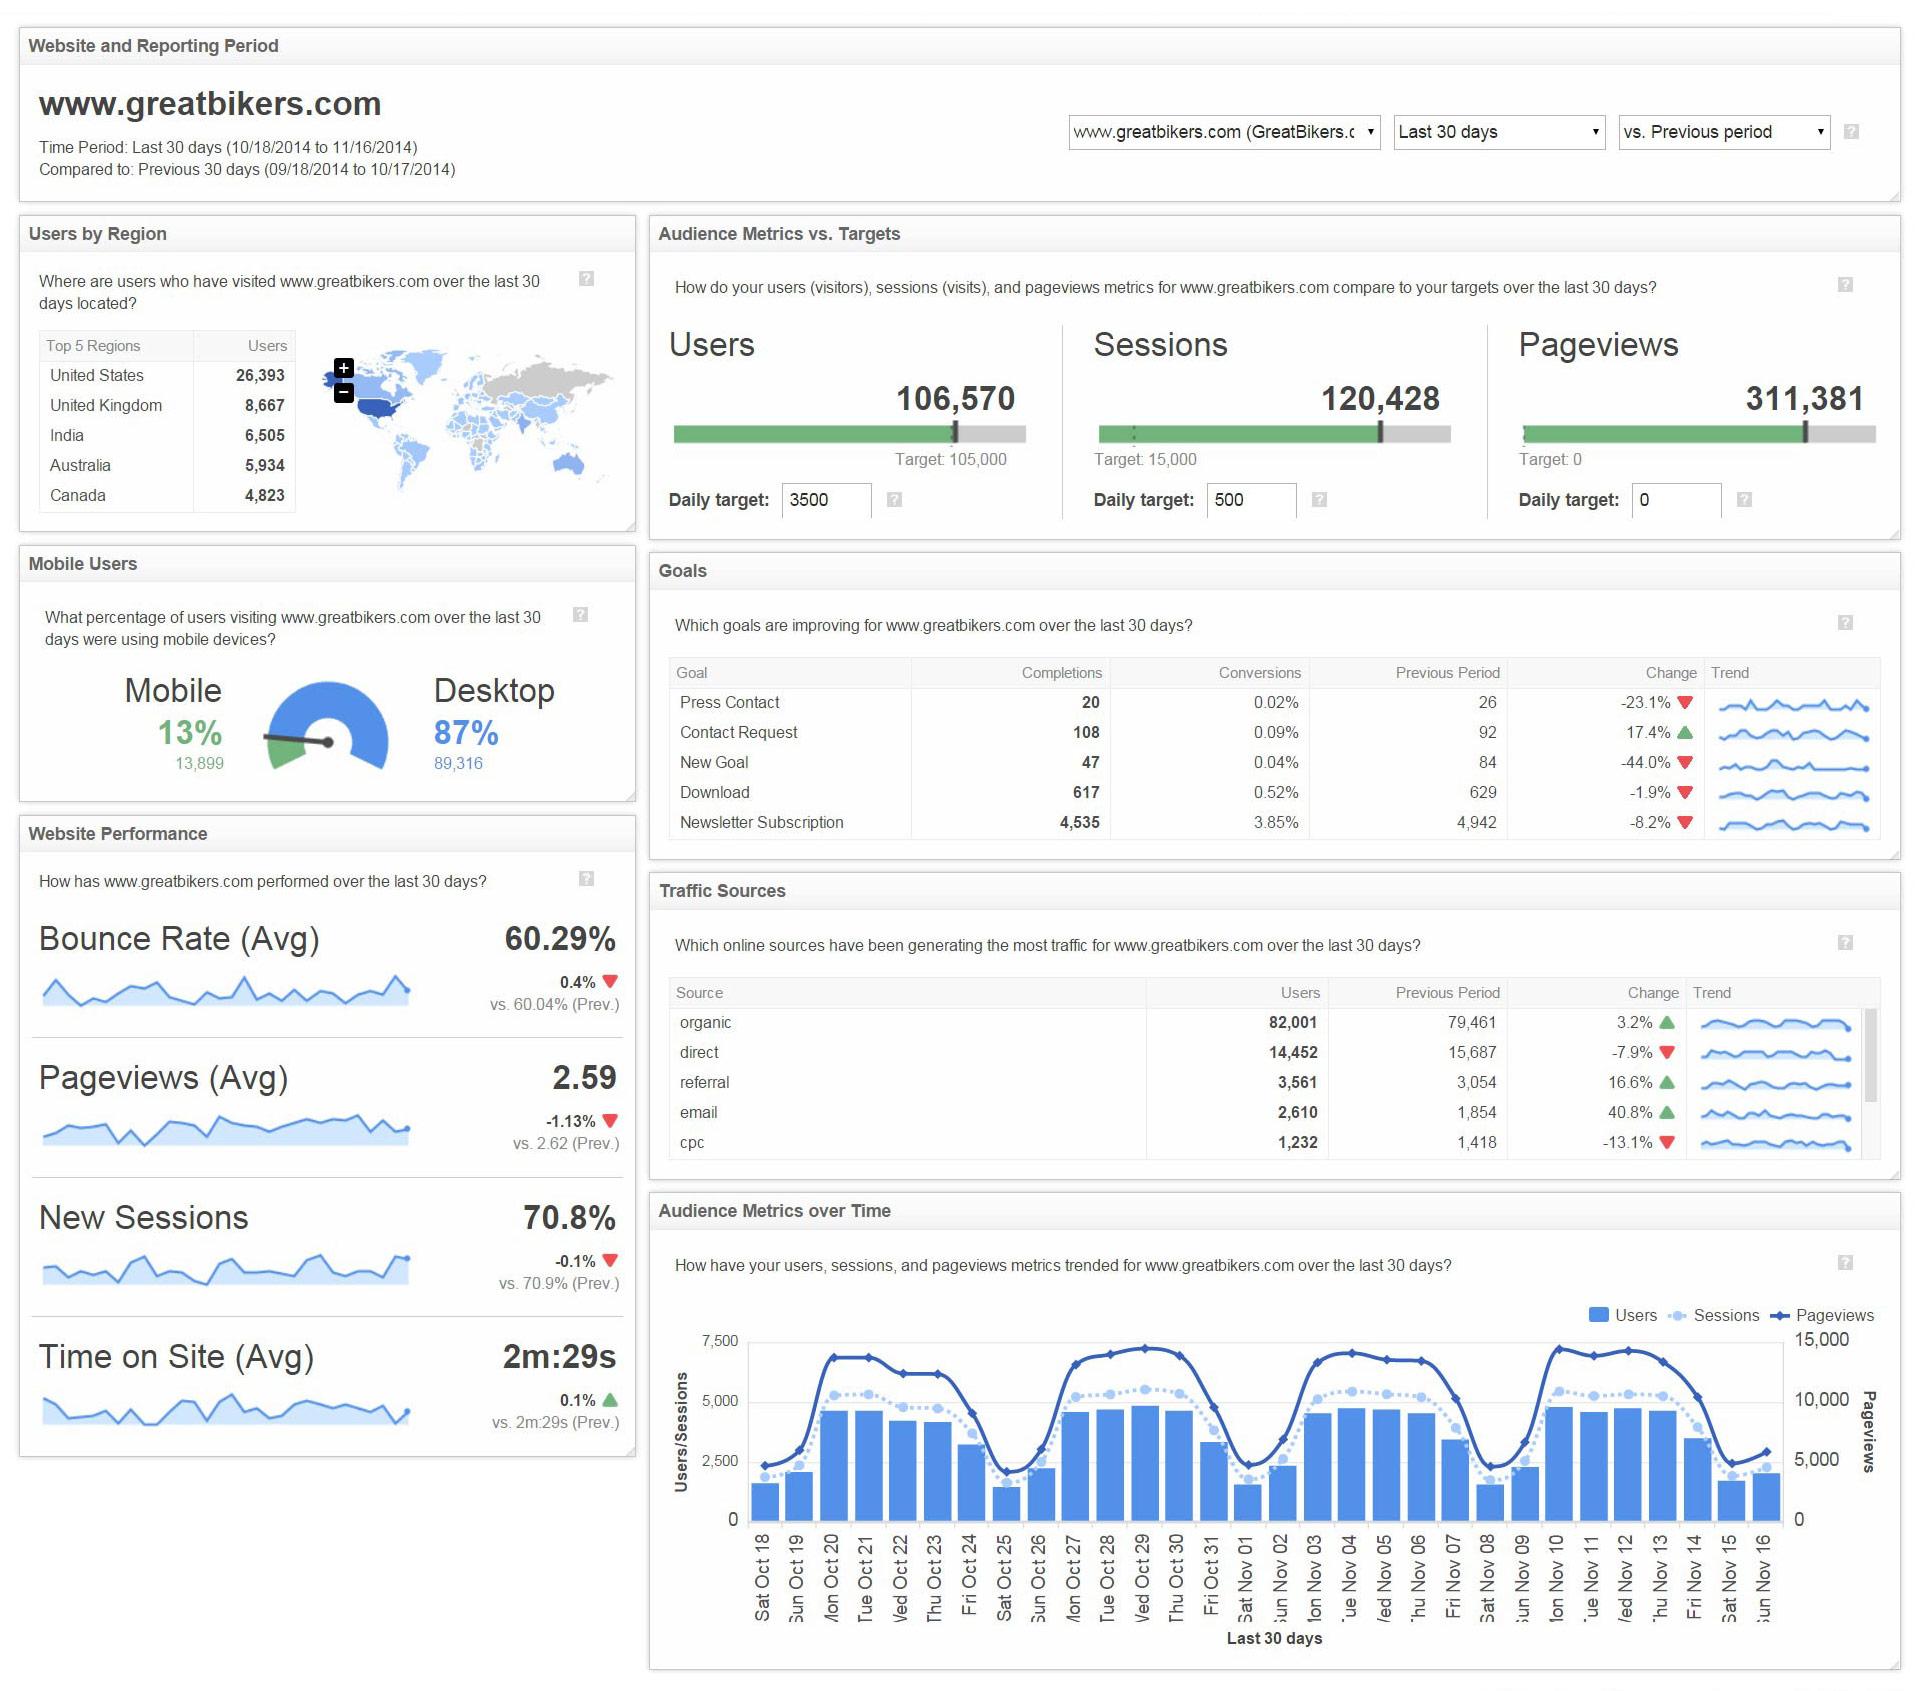
Real-time dashboards and automated refresh
Dashboards can be set to refresh automatically at chosen intervals, so charts and KPIs stay in sync with underlying systems. This reduces manual work and gives stakeholders confidence that what they are seeing reflects the latest state of the business. -
Centralized metrics definitions
With a metrics-first approach, important KPIs are defined once and reused everywhere. Metrics such as revenue, conversion rate, churn, or customer lifetime value become standardized objects instead of ad-hoc formulas in separate reports. -
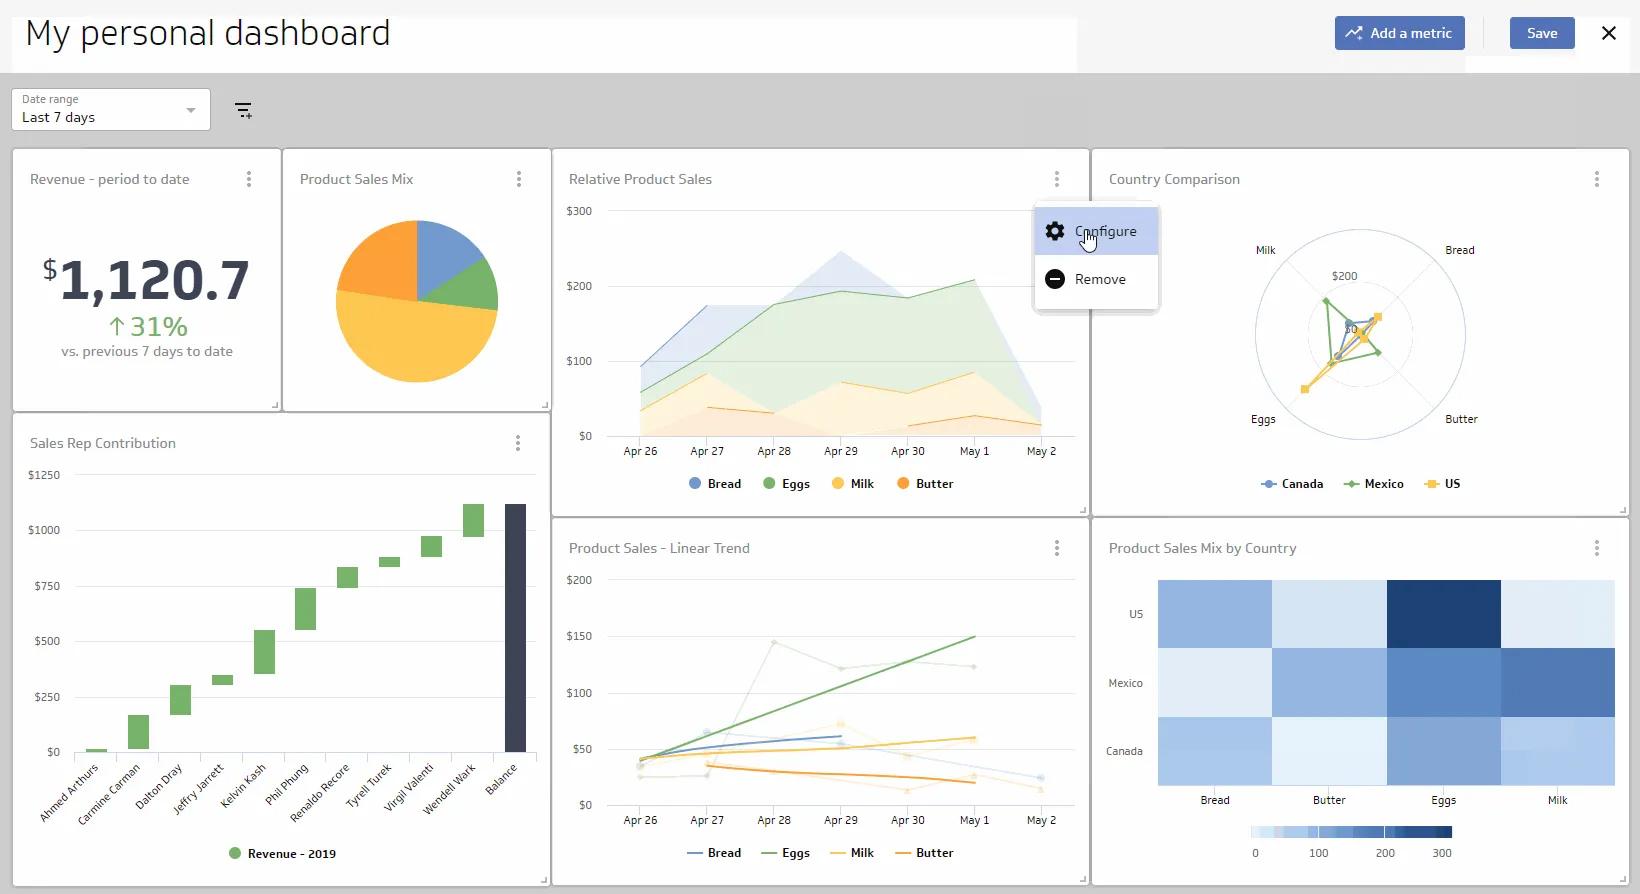
Flexible visualizations and layout control
Klipfolio offers many visualization types, from simple line and bar charts to more advanced visuals and composed layouts. Users can adjust sizing, grouping, fonts, and colors to create dashboards that fit brand guidelines and highlight what matters most. -
White-labeling and multi-client management
Agencies and service providers can brand dashboards with their own identity or the client’s identity. Multi-client management makes it easy to reuse templates, roll out similar dashboards to many accounts, and maintain separation between clients. -
Sharing, embeds, and scheduled reports
Dashboards can be shared via links, embedded inside portals or internal tools, or delivered as regular reports. Scheduled emails and exports keep people in the loop even if they never log into the main interface.
How can Klipfolio be used in real situations?
-
Marketing and acquisition performance
Connect advertising platforms, social channels, and analytics tools to track spend, clicks, conversions, and return on ad spend in one view. Marketing teams can react quickly to underperforming campaigns or channels. -
Sales and revenue monitoring
Tie in CRM and billing data to follow pipeline volume, deal stages, win rates, recurring revenue, and forecasts. Sales managers can track daily performance and spot bottlenecks before they turn into missed targets. -
Executive and investor dashboards
Combine financial results, customer metrics, and operational KPIs into concise executive dashboards. Leadership teams gain a live overview of the business without digging through multiple systems or reports. -
Agency client reporting
Agencies can provide each client with a branded performance dashboard that updates automatically. Instead of building monthly slide decks, they share always-on views for traffic, conversions, and campaign metrics. -
Product and SaaS analytics
Monitor activation, feature usage, subscription metrics, and churn in time-series views. Product and growth teams better understand user behavior and the impact of changes on key subscription KPIs.
What benefits does Klipfolio deliver to teams?
The main benefit of Klipfolio Dashboards And Metrics Platform is the reduction of time spent on manual reporting. Once connections and metrics are configured, dashboards update automatically, freeing analysts and managers to focus on decisions rather than data wrangling.
The standardized metrics layer reduces confusion and arguments over which number is correct. Everyone uses the same definitions, which improves collaboration between departments and supports more confident planning.
For agencies and consultants, the platform turns reporting into a scalable service. Templates, white-label branding, and client management features allow them to serve more clients with less repetitive work.
Overall, the platform helps organizations become more data-driven, shifting attention from reactive reporting to proactive monitoring and optimization.
How does the Klipfolio user experience feel?
Users typically work from a web-based interface where they connect data sources, define metrics, and build dashboards with drag-and-drop controls. Analysts can create more complex formulas and data models, while non-technical users explore existing dashboards, filter data, and change date ranges without needing to know any code.
Dashboards can be organized by team, function, or client, making it easy to find relevant views. Alerts, goals, and schedule-based reports help users stay informed even when they are not actively checking the platform.
Because Klipfolio Dashboards And Metrics Platform is accessible through browsers, mobile devices, and large screens, it fits different work styles: from individual contributors checking metrics over coffee to teams running big-screen KPI command centers in the office.
2025-06-02 17:57:33: Executive Dashboard | Live Dashboard Overview Youtube
2025-06-02 17:55:05: Google Analytics Dashboard | Live Dashboard Overview Youtube
2025-06-02 17:54:06: Account Health Visualization | Live Visualization Overview Youtube
2025-06-02 17:53:02: Email Marketing Dashboard | Live Dashboard Overview Youtube
2025-06-02 17:51:41: Support Ticket Dashboard | Live Dashboard Overview Youtube
2025-06-02 17:49:57: Cash Flow Dashboard | Live Dashboard Overview Youtube
2025-02-07 17:39:27: The Big Game Dashboard - Klipfolio Klips Youtube
2024-08-01 16:00:07: The Future of Healthcare, with Duncan Weatherston Youtube
2024-06-21 17:35:56: PowerMetrics AI | PowerMetrics Youtube
2024-06-19 01:50:19: Cumulative Aggregation | PowerMetrics Youtube
2023-04-07 03:23:59: Due to the super positive response to our metric assistant in the past week, we've decided to add an "easter egg" into PowerMetrics as well. Happy hunting! #chatgpt #chatbot #metrics #metrichq https://t.co/FXZvKV8foP https://t.co/yIJ0AmHQJjTwitter
2023-04-01 20:11:24: Unlock data-driven decisions with ChatGPT & MetricHQ – like a tiny data scientist in your browser. Type a term & get tailored answers from our MetricHQ database!
Try out the chatbot: https://t.co/gLELXdWxQ1
Check out our blog post: https://t.co/FXZvKV8foP https://t.co/0gUXOydGK3Twitter
2023-04-01 18:23:06: Today, we're excited to go back to the future. https://t.co/rTZ3QDl3SATwitter
2022-12-22 23:03:06: #YearInReview 6/6 Generosity and Humanity
In a world that has seen unspeakable injustices and sufferings, it has been countered by kindness, generosity, and acceptance. Our deep hope is for peace in 2023. https://t.co/Fec8gFNYaQ #PeaceInUkraine #equality #acceptance #kindness https://t.co/so8a395h8oTwitter
2022-12-22 03:59:46: #YearInReview 5/6 Thought Leadership
A community of experts taking, sharing, and debating metrics... it doesn't get much better than that. https://t.co/UYCHIZ7JmO
#analytics #metrics #KPIs #podcast https://t.co/kLBQCVgNA9Twitter
2022-12-20 23:26:21: #YearInReview 4/6 Experience
Our UX, design and product teams are listening to it all - from rage clicks to happy clicks. #analytics #ux #data https://t.co/hFSCCs2gch https://t.co/Dlgq8PTa3yTwitter
2022-12-20 00:14:25: #YearInReview 3/6 Award Winning Support.
Hands down, our customer support team is, and always has been, the best. Friendly, knowledgeable, and helpful. #analytics #data https://t.co/fOO0z2OKde https://t.co/CgbHtgq9SZTwitter
2022-12-16 20:55:51: #YearInReview 2/6 Performance at Scale.
I think we can all agree - this is the biggest vanity metric... ever! #Analytics #data https://t.co/fOO0z2OKde https://t.co/7RSSYFKBPCTwitter
2022-12-15 23:08:11: 2022 has been busy! Happy holidays and a big thank you to everyone who made it a success!
With over 400 releases this year, let's start by talking Innovation and Quality. 1/6 #YearInReview #Analytics #data https://t.co/APWaohjgScTwitter
2022-11-30 19:33:54: Having announced Data Feeds on Monday, *Live Preview* will be our second amazing feature that will be launched very very soon. See the impact of editing your metrics as a live preview, in real time! 🚀 https://t.co/7BYEQ8L07lTwitter
