
Kibana
Languages:
Deutsch
English
Español
Français
日本語
Portuguese
简体中文
Localization:
World
What is Kibana used for?
Kibana is a data visualization and analytics interface built to work with Elasticsearch. It helps teams explore large volumes of data through dashboards, charts, filters, and interactive views. Instead of reading raw logs, events, or metrics line by line, users can turn technical data into visual insights that are easier to understand and act on.
Kibana is commonly used for monitoring infrastructure, analyzing logs, tracking application performance, investigating incidents, and reviewing operational trends. It fits especially well in environments where data is constantly changing and needs to be searched in near real time. Because it combines search, visualization, and dashboarding in one workspace, Kibana is useful for technical teams that need both overview and detail. It is often part of a broader Elastic environment, but its direct value comes from helping teams move from data collection to practical visibility.
What key features does Kibana offer?
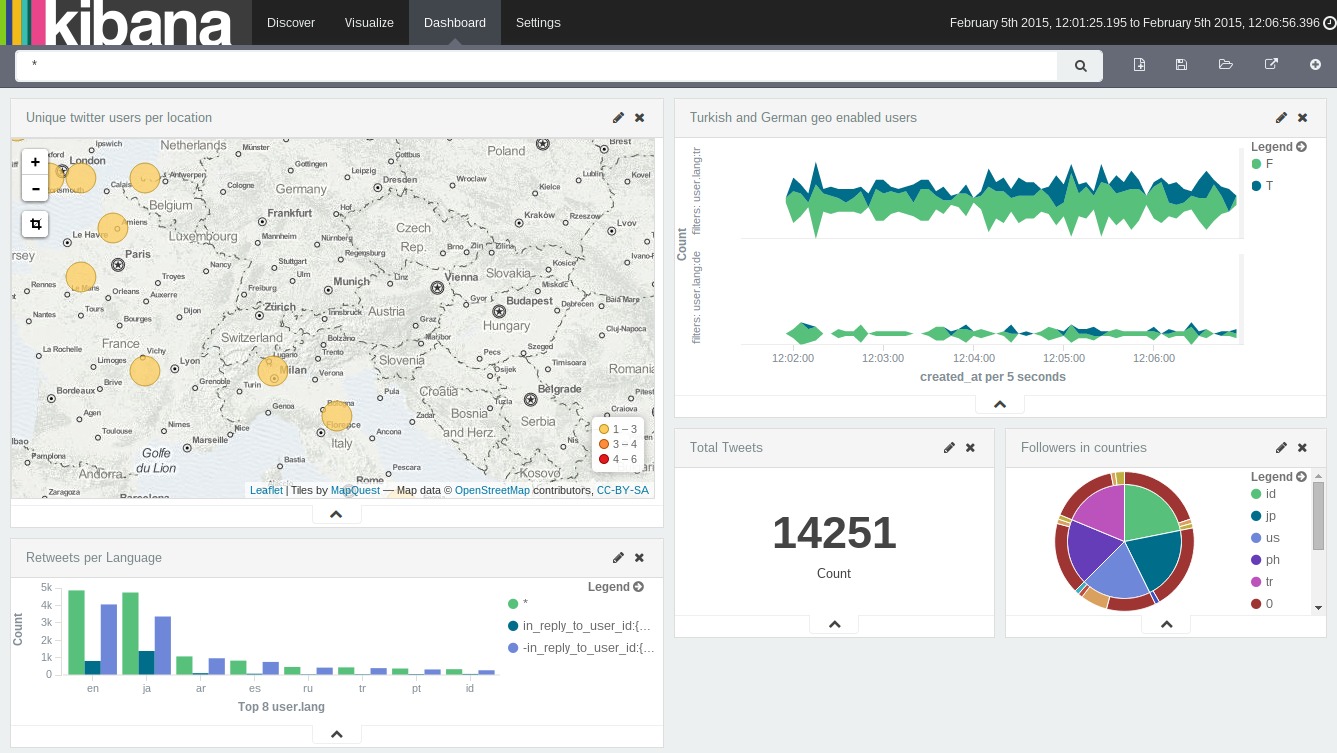
- Interactive Dashboards
Kibana allows users to build dashboards with charts, tables, metrics, and filters that update as data changes. These dashboards can combine multiple data views into a single workspace for monitoring systems, services, or business processes. - Advanced Data Exploration
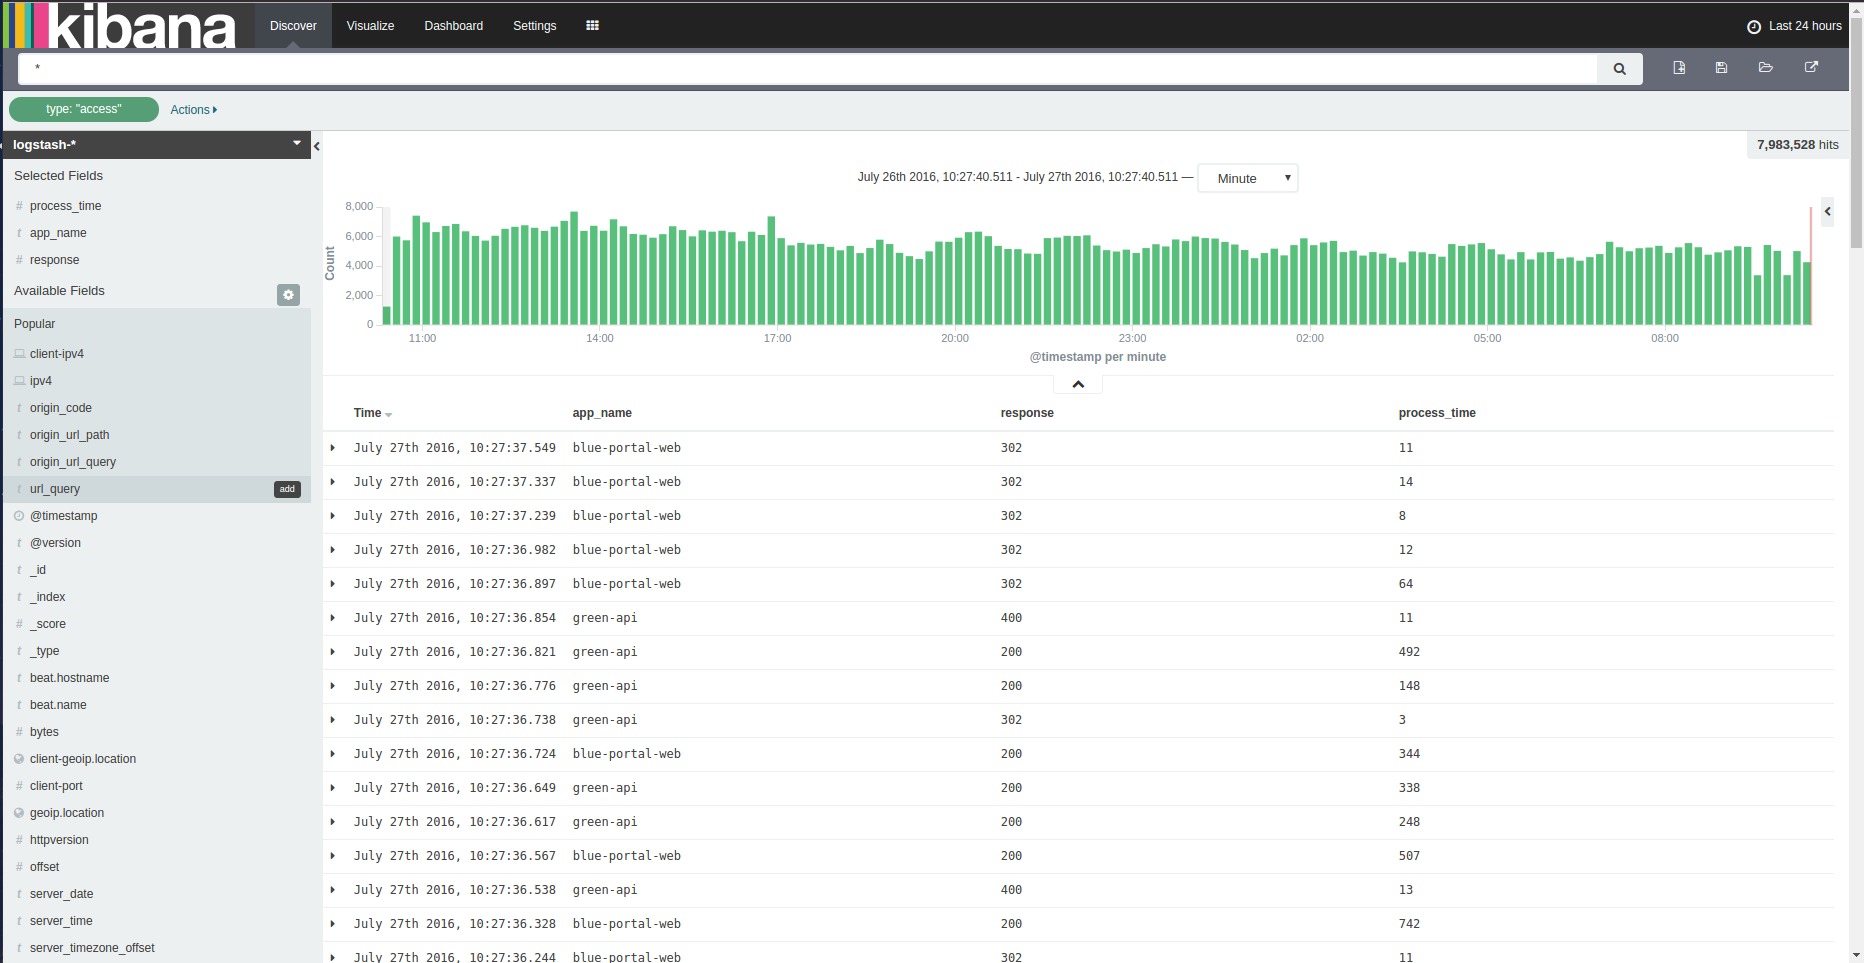
Users can search, filter, and drill into datasets quickly. This is useful for investigating errors, spikes, trends, or unusual behavior without needing to manually process raw records. - Visualization Tools
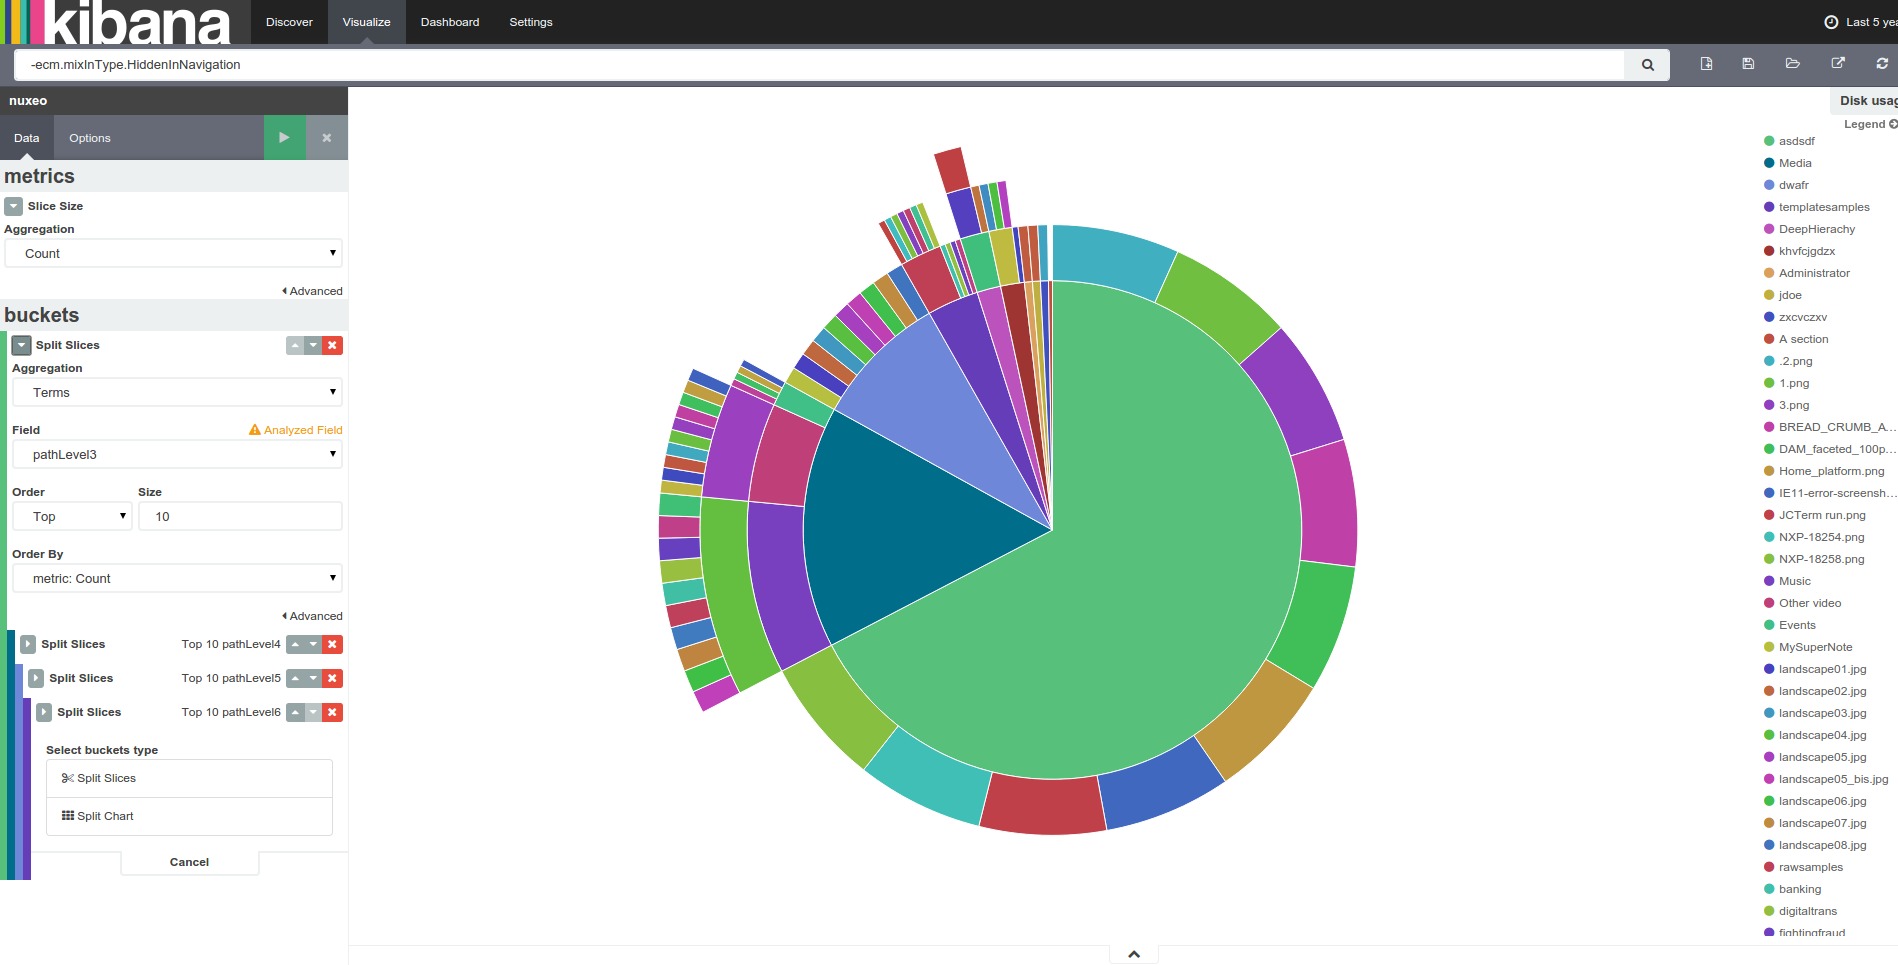
Kibana supports many visualization formats, including bar charts, line charts, area charts, pie charts, maps, and more. These tools help present complex information in a way that supports faster analysis. - Log and Event Analysis
Kibana is widely used for reviewing logs and event streams. Teams can identify failed requests, trace issues across systems, and find patterns in operational data. - Alerting and Monitoring Support
It can be used alongside alerting workflows so teams can monitor changes and respond to incidents more efficiently. This helps reduce the delay between detection and action. - Custom Views for Different Teams
Dashboards and saved searches can be tailored for developers, operations teams, analysts, or managers. This makes Kibana flexible across both technical and operational roles. - Scalable Search Experience
Since it works with Elasticsearch, Kibana is designed to handle large datasets. It remains useful even in environments with heavy log volume, high event frequency, or multiple data sources.
Where is Kibana most useful in real work?
- Infrastructure Monitoring
Operations and DevOps teams use Kibana to watch server health, service behavior, usage patterns, and system events through visual dashboards. - Application Troubleshooting
Developers can inspect logs, detect errors, and trace application issues faster by filtering events and isolating relevant time periods. - Security Investigation
Security teams can review suspicious events, inspect patterns, and analyze large event datasets in a more structured visual environment. - Performance Observation
Kibana helps track response times, traffic patterns, and operational anomalies, making it useful for identifying slowdowns or unstable services. - Business Event Analysis
Teams can also use Kibana to visualize user activity, transactions, internal workflows, or operational KPIs when that data is stored in Elasticsearch.
Why do teams choose Kibana?
Kibana gives teams a practical way to understand machine-generated and event-driven data without building a custom interface from scratch. It reduces the gap between raw data and usable insight. This can improve troubleshooting speed, support better monitoring, and make recurring analysis more efficient.
Another advantage is flexibility. Kibana can serve as a shared visibility layer across engineering, operations, and analytics use cases. Instead of switching between multiple tools for search, charts, and dashboards, teams can work in one environment. It is especially strong for organizations that need continuous visibility rather than static reporting.
Kibana also supports faster decision-making. When data is visual, filterable, and searchable in one place, it becomes easier to identify trends, detect issues early, and communicate findings across teams.
What is the user experience like in Kibana?
Kibana offers a workspace that feels analytical and operational at the same time. Users can move from high-level dashboards to detailed log inspection without leaving the platform. The interface is designed for active exploration, not just passive viewing, which makes it valuable for teams that regularly investigate changing data.
For technical users, Kibana is powerful because it gives direct control over filters, time ranges, and search behavior. For less technical stakeholders, dashboards provide a cleaner way to consume information without needing to understand the underlying data structure in depth.
The overall experience is strongest when Kibana is set up with clear dashboards, meaningful visualizations, and well-structured data sources. In that setup, it becomes a sharp operational lens rather than just another analytics screen.
2026-07-10 16:50:18: Cathay Pacific cut operational noise by approximately 30% by unifying observability on Elastic Cloud. Youtube
2026-07-09 13:35:42: Elastic SIEM: how Ennovi's CISO replaced MDR with one console Youtube
2026-07-07 14:18:33: KVK unifies logs, metrics, and traces with Elastic Observability. Youtube
2026-05-01 15:00:00: Elastic + Azure: The scalable security stack driving better outcomes Youtube
2026-04-30 15:00:00: How Gigamon uses Elastic to accelerate teams from detection to remediation. Youtube
2026-04-29 15:00:00: Elastic Security: an agentic security operations platform Youtube
2026-04-10 17:00:00: Here’s the translation of your text into English:
"How Kyndryl and Elastic help improve performance while managing cost."
(Note: Since the original text is already in English, no translation is needed.) Youtube
2026-04-09 17:00:00: Inside Kyndryl’s AI security strategy with Kibana Youtube
2026-03-25 18:43:49: AI can do what now?! - Detecting financial fraud with Kibana. Youtube
2026-03-11 17:00:00: The hidden risks of AI rule conversion in SIEM migrations Youtube
2023-04-07 19:45:00: Ingest and manage Nginx logs using Elastic agent in less than 5 minutes! Get started by watching this quick tutorial: https://t.co/x714j3jZOdTwitter
2023-04-06 17:45:00: Learn how you can apply a named entity recognition #NLP model in Elasticsearch on the blog: https://t.co/VaPdeOMckrTwitter
2023-04-05 21:23:01: With a rapidly changing macroeconomic backdrop, leaders look to do more with their people and technology. In this blog, we’re taking a look at a few key observability trends and predictions impacting the industry in 2023 and beyond. Learn more: https://t.co/gH4XQQL48TTwitter
2023-04-04 19:28:19: It all comes down to this: Synthetics vs ESQL. Cast a vote for your favorite feature and help us crown the 2023 #ElasticMadness winner 👑Twitter
2023-04-03 19:59:32: ESQL is on to the championship round of #ElasticMadness! Watch this #ElasticON session to learn how ESQL fundamentally transforms and expands the analytics and data processing of Elasticsearch: https://t.co/ntLjFP9tuUTwitter

